• Hello, please take a minute to check out our awesome content, contributed by the wonderful members of our community. We hope you'll add your own thoughts and opinions by making a free account!

Learning Global Warming facts and fiction

Status
Not open for further replies.
No, science seeks to ask better questions and evaluate all possible options that may or may not explain the changes we see going on. Science is always uncovering new data and there are plenty of factors that we likely do not understand at all or have a poor grasp on due to the limited amount of time that we have been able to measure changes with satellites and other modern technologies. There always have been and will be economic disasters like hurricanes, the Dust Bowl, floods, etc it's just a part of life and dealing with what happens in nature.

Another interesting note, if indeed the oceans were to warm up significantly over time this would likely decrease tropical activity (in the Atlantic) since El Nino would be more common and it typically brings high shear values that are detrimental to TC development and growth, no matter how warm the waters are.

Most of the science to date supports the theory that man is playing a significant role in modern climate changes, but a warmer climate as you mentioned later on actusllt doesn’t favor more El Ninos, if you have studied paleoclimate records and modern record keeping, you’d actually find that the inverse is true, La Niñas are favored with a warmer globe but why? In a general sense where I think most here can understand, the climate warms, the Hadley Cell expands, this results in larger seasonal variability in the ITCZ which favors the monsoon circulations over the Eastern hemisphere and off equatorial convection. The stronger E Hem monsoon skews the ENSO distribution towards La Niñas that also favors more frequent +NAOs/AOs. You should seriously consider studying what happened in the medieval warming period for confirmation of this relationship, because this period of global warming was dominated by La Niñas whereas the Little Ice Age featured more Ninos relatively speaking.
https://journals.ametsoc.org/doi/10.1175/JCLI-D-12-00598.1

https://journals.ametsoc.org/doi/abs/10.1175/2008JCLI2200.1
 
Most of the science to date supports the theory that man is playing a significant role in modern climate changes, but a warmer climate as you mentioned later on actusllt doesn’t favor more El Ninos, if you have studied paleoclimate records and modern record keeping, you’d actually find that the inverse is true, La Niñas are favored with a warmer globe but why? In a general sense where I think most here can understand, the climate warms, the Hadley Cell expands, this results in larger seasonal variability in the ITCZ which favors the monsoon circulations over the Eastern hemisphere and off equatorial convection. The stronger E Hem monsoon skews the ENSO distribution towards La Niñas that also favors more frequent +NAOs/AOs. You should seriously consider studying what happened in the medieval warming period for confirmation of this relationship, because this period of global warming was dominated by La Niñas whereas the Little Ice Age featured more Ninos relatively speaking.
https://journals.ametsoc.org/doi/10.1175/JCLI-D-12-00598.14

https://journals.ametsoc.org/doi/abs/10.1175/2008JCLI2200.1
We have so much to learn about the complexities and relationships in our atmosphere. It's great to have theories, a consensus, etc. but at the same time as you know science is always discovering new facts that change how we understand things. Statements that "most of science" agrees upon something are incredibly vague and overused. There is a lot we have to learn about our climate and there are smart people on both sides who would disagree with each other.

Climate change detection and attribution have proven unexpectedly challenging during the 21st century. Earth’s global surface temperature increased less rapidly from 2000 to 2015 than during the last half of the 20th century, even though greenhouse gas concentrations continued to increase. A probable explanation is the mitigation of anthropogenic warming by La Niña cooling and declining solar irradiance. Physical climate models overestimated recent global warming because they did not generate the observed phase of La Niña cooling and may also have underestimated cooling by declining solar irradiance. Ongoing scientific investigations continue to seek alternative explanations to account for the divergence of simulated and observed climate change in the early 21st century, which IPCC termed a “global warming hiatus.” … Understanding and communicating the causes of climate change in the next 20 years may be equally challenging. Predictions of the modulation of projected anthropogenic warming by natural processes have limited skill. The rapid warming at the end of 2015, for example, is not a resumption of anthropogenic warming but rather an amplification of ongoing warming by El Niño. Furthermore, emerging feedbacks and tipping points precipitated by, for example, melting summer Arctic sea ice may alter Earth’s global temperature in ways that even the most sophisticated physical climate models do not yet replicate.

Solar influence likely plays a key role in the various ways our atmosphere changes over decades and centuries. There is good evidence as cited below that these changes play an important role in cyclical changes of the patterns we see on earth, the complexities of which we barely understand at this time.
Lubin et al., 2018 Over the past decade there has been increasing realization and concern that the steady and high solar luminosity of the past century may transition to greater variability later this century (Abreu et al. 2008; Feulner & Rahmstorf 2010; Lockwood 2010). Specifically, the Sun may descend into a period of low magnetic activity analogous to the historical Maunder minimum (MM; circa 1640–1715; Eddy 1976). A resulting decrease in total solar irradiance (TSI) impacting the terrestrial lower atmosphere energy budget is linked to changes in high-latitude circulation patterns that strongly influence the climate of Europe and the Atlantic sector of the Arctic and subArctic (Song et al. 2010; Meehl et al. 2013), and may also influence Antarctic climate (Orsi et al. 2012). Studies have also shown the importance of stratospheric response to a grand minimum (e.g., Gray et al. 2010; Bolduc et al. 2015; Maycock et al. 2015). Over a solar cycle and certainly in response to a future grand minimum, irradiance variability at middle ultraviolet (UV) wavelengths that drive oxygen photolysis and ozone chemistry is much larger that that of the TSI. Resulting changes to stratospheric ozone abundance alter the stratosphere–troposphere temperature gradient and feed back to tropospheric planetary wave refraction, further altering climatically relevant circulation patterns (Maycock et al. 2015). With this realization that both direct radiative and indirect stratospheric influences affect terrestrial climate under a solar grand minimum, it is important to understand how UV irradiance would respond to such a large and prolonged change in solar magnetic activity.

Then this
Shi et al., 2018 The results show that during periods of strong solar activity, the solar shortwave heating anomaly from the climatology in the tropical upper stratosphere triggers a local warm anomaly and strong westerly winds in mid-latitudes, which strengthens the upward propagation of planetary wave 1 but prevents that of wave 2. … The Sun is the most important source of energy in the Earth’s climate system and variations in the intensity of solar radiation influence both the weather and climate (Chen et al., 2015; Rind, 2002, 2008; Shang et al., 2013; Wang et al., 2015; Zhao et al., 2012). Gray et al. (2010) showed that there are two main mechanisms, bottom-up mechanism and top-down mechanism, by which solar activity affects the Earth’s climate. The top-down mechanism is connected to solar ultraviolet radiation. Solar ultraviolet radiation is mainly absorbed by ozone in the tropical stratosphere, which changes the meridional temperature gradient and wind field in the atmosphere. This further affects the propagation of stratospheric planetary waves in the winter hemisphere (Balachandran and Rind, 1995). Therefore, the solar radiation change can affect the interaction between the stratospheric circulation and the planetary waves (Haigh, 1996, 1999; Kodera and Kuroda, 2002; Shindell et al., 1999, 2006).
 
We have so much to learn about the complexities and relationships in our atmosphere. It's great to have theories, a consensus, etc. but at the same time as you know science is always discovering new facts that change how we understand things. Statements that "most of science" agrees upon something are incredibly vague and overused. There is a lot we have to learn about our climate and there are smart people on both sides who would disagree with each other.


Solar influence likely plays a key role in the various ways our atmosphere changes over decades and centuries. There is good evidence as cited below that these changes play an important role in cyclical changes of the patterns we see on earth, the complexities of which we barely understand at this time.

Then this

There's also some evidence that volcanic activity tends to increase during a grand minimum and that that possibly is the primary reason for any significant cooling that may have occurred during those periods:

http://southernwx.com/community/threads/historic-solar-cycle-minimum-coming.105/page-2#post-102659
 
Last edited:
We have so much to learn about the complexities and relationships in our atmosphere. It's great to have theories, a consensus, etc. but at the same time as you know science is always discovering new facts that change how we understand things. Statements that "most of science" agrees upon something are incredibly vague and overused. There is a lot we have to learn about our climate and there are smart people on both sides who would disagree with each other.


Solar influence likely plays a key role in the various ways our atmosphere changes over decades and centuries. There is good evidence as cited below that these changes play an important role in cyclical changes of the patterns we see on earth, the complexities of which we barely understand at this time.


Then this
The first statement isn’t incredibly vague at all, if you search for scholarly articles published in reputable journals you’ll find most of them concur that anthropogenic climate change is real and man plays a significant role in modern climate how significant remains to be seen, the information is out there for you. Problem is we really don’t understand solar and climate relationships at all especially in the troposphere and the direct radiative forcing (UV is more significant but this is applicable mainly for the stratosphere) variability from the sun pales in comparison to the cumulative change we’ve imposed in the last few centuries by releasing GHGs into the atmosphere. What you’ve shown above I don’t disagree with at all in a general sense but you’ve overlooked the fact that these studies did not compare the contribution from solar and anthropogenic sources of climate variability, they only provided links between solar activity and the climate that many scientists who aren’t skeptical of AGW are already well aware of. The patterns are in part cyclical and the earth likely would have warmed anyway coming out of the LIA, but they’ve been appreciably augmented arguably even more so than they would have been “naturally”. The current orbital, solar, and obliquity configuration would suggest we should enter an ice age in a few thousand years however that doesn’t seem anywhere near as likely because dissolution and sequestration of CO2 out of both the mid upper oceans and atmosphere will take no less than several hundred years to be eradicated by a substantial margin
 
Last edited:
"We have so much to learn about the complexities and relationships in our atmosphere."
Alex Jones

 
"We have so much to learn about the complexities and relationships in our atmosphere."
Alex Jones
You’re implying that it’s dumb just because he said it. That’s fine. He’s a dummy. But are you really comfortable going with the opposite?

“We know everything there is to know about the complexities and relationships in our atmosphere.”

In reality, we have limited data and limited understanding, both of which will grow with time.
 
I love this video... it brings the two camps into a fierce battleground... one, with a pile of data and interpetation to back them, while the other draws blank swords from every possible angle to refute the numbers.
 
Earth is about to become much less habitable. The body count is about to sky rocket into the billions which would destabilize civilization making any efforts toward a carbon free world impossible. We are too late.

https://www-m.cnn.com/2018/08/07/health/hothouse-earth-warming-intl/index.html


Sent from my iPhone using Tapatalk
Lol you're suggesting half the world would die which isn't likely from just that. The article seems like a doomsday one and worst possible scenario fear piece written by a nutjob. The icecaps aren't all just going to melt all at once. I just laugh at these articles since its clickbait and says the worst possible outcome.
 
We view the Earth as some place that will always support life. Who's to say its time hasn't come? Are we the generation ushering in its end? Some scientist and politicians that are "in the know" would suggest that our warming is a direct result of climate negligence. You see it all the time, single person driving around in a Tahoe, Expedition, or some other inefficient vehicle and imply the question (why do they need that kind of vehicle?). We can't change nature (yet), all we can do is control our own decision to be good stewards of the Earth and keep it as habitable as long as we can before we destroy it. That's the idea and worldview that is being tossed around.
 
I hope like heck (though I’m not predicting it) that the anticipated solar grand minimum will help lead to a nontrivial global temperature drop over the next few decades. If not, we may be in deep doo doo. In the meantime, one positive effect of increased CO2 is that it is conducive to more plant growth/greater food supply. Might the increased greening produce a reverse feedback of cooling?? Any thoughts?
 
Larry,
It is possible in this day and age for someone to find a chart or graph that says whatever the person wants to postulate. Cross-examined that "expert" today. What seems to be partially missing in this whole discussion is history, cycles and forces we still have no understanding of.
Ergo, I avoid the discussion realizing I know too little to contribute.
But, this I'll toss this out and can absolutely verify as fact ... it's hot as Hades outside today ... LOL
Best!
Phil

I don’t know who has a better way with words, Tony (@dsaur) or yourself? You two would do well as writers.
But regarding what you said, yes, indeed. That makes it so hard to decide what to believe. Let’s hope that old sol will have a nontrivial say so in all of this soon.
 
I hope like heck (though I’m not predicting it) that the anticipated solar grand minimum will help lead to a nontrivial global temperature drop over the next few decades. If not, we may be in deep doo doo. In the meantime, one positive effect of increased CO2 is that it is conducive to more plant growth/greater food supply. Might the increased greening produce a reverse feedback of cooling?? Any thoughts?

There is some data out there that indicates increased CO2 levels have led to increased crop yields and plant life, see below.
Zeng et al., 2018 Leaf area index (LAI) is increasing throughout the globe, implying the Earth greening. Global modelling studies support this contention, yet satellite observations and model simulations have never been directly compared. Here, for the first time, we used a coupled land-climate model to quantify the potential impact of the satellite-observed Earth greening over the past 30 years on the terrestrial water cycle. The global LAI enhancement by 8% between the early 1980s and the early 2010s is modelled to have caused increases of 12.0 ±2.4 mm yr-1 in evapotranspiration and 12.1 ±2.7 mm yr-1 in precipitation — about 55 ±25% and 28 ±6% of the observed increases in land evapotranspiration and precipitation, respectively.

Since the polar bears are supposed to go extinct according to the climate fear mongers out there, let's look at some research data recently done on that.
Laforest et al., 2018 A majority of participants indicated that the local polar bear population was stable or increasing. … [Participants] indicated that polar bear body condition is stable; they cited the fact that polar bears are capable of hunting seals in open water as a factor contributing to the stable body condition of the bears. … None of the participants explicitly linked the effects of a warming climate to specific impacts on polar bears. … Five participants indicated that polar bears are adept swimmers capable of hunting seals in open water. Residents of communities along Baffin Bay have also expressed this viewpoint (Dowsley and Wenzel, 2008), whereas Inuvialuit of the Western Arctic had variable perceptions of the ability of bears to catch seals in open water (Joint Secretariat, 2015). The view of polar bears as effective open-water hunters is not consistent with the Western scientific understanding that bears rely on the sea ice platform for catching prey (Stirling and McEwan, 1975; Smith, 1980). The implications of this disagreement are paramount, given that scientists suggest that the greatest threat to polar bears associated with a decrease in sea ice is a significant decrease in access to marine mammal prey (Stirling and Derocher, 1993; Derocher et al., 2004) … A recent aerial survey of the Southern Hudson Bay subpopulation concluded that the abundance of polar bears has remained steady since 1986 (943 bears; SE: 174) (Obbard et al., 2015). The survey included the entire coastal range and offshore island habitat of the Southern Hudson Bay subpopulation, except for the eastern James Bay coast. Taken together, the results of the aerial survey and the participant responses from Wemindji and Chisasibi indicate that the local population has remained stable. However, the unanimous responses from participants in Whapmagoostui/Kuujjuarapik suggest that there has been a localized increase in the number of bears near Whapmagoostui/Kuujjuarapik.

Tropical activity in the Atlantic has shown a decrease in recent years rather than the gloom and doom predictions of more hurricanes.
Truchelut and Staeling, 2018 The extremely active 2017 Atlantic hurricane season concluded an extended period of quiescent continental United States tropical cyclone landfall activity that began in 2006, commonly referred to as the landfall drought. We introduce an extended climatology of U.S. tropical cyclone activity based on accumulated cyclone energy (ACE) and use this data set to investigate variability and trends in landfall activity. The [hurricane landfall] drought years between 2006 and 2016 recorded an average value of total annual ACE [accumulated cyclone energy] over the U.S. that was less than 60% of the 1900–2017 average. Scaling this landfall activity metric by basin-wide activity reveals a statistically significant downward trend since 1950, with the percentage of total Atlantic ACE expended over the continental U.S. at a series minimum during the recent drought period.

Then there is the infamous "climategate" scandal where it was revealed that scientists writing views opposing or questioning man-made global warming (in favor of natural cycles) were intentionally silenced/not published.
Olson, 2018 Opinion polls and other research show a public that frequently perceives climate science and associated AGW threats as complicated, uncertain and temporally and spatially distant (Anghelcev et al., 2015; Bennett et al., 2016; Gordon et al., 2011). Thus climate scientists, celebrities, public policymakers and other AGW social marketers face a daunting task in convincing a lackadaisical and often skeptical public to support AGW mitigating behaviors and policies. The difficulty of this marketing assignment has also led to the utilization of ethically questionable tactics that hype the severity, immediacy and certainty of AGW threats (O’Neil and Nicholson-Cole, 2009; Rogers, 1975; Rosenberg et al., 2010).
For example, the past 25 years have witnessed a large number of greatly exaggerated predictions regarding the speed and scope of temperature increases and AGW dangers from a variety of AGW “endorsers,” which have fortunately proven to be false alarms (Bastasch, 2015; Grundmann, 2011; Michaels, 2008; Newman, 2014). Another ethically questionable example is provided by the Climategate scandal involving members of the climate science community and their attempts to increase public certainty regarding the methods and predictions of “mainstream” climate models by blocking the publication of research not supportive of the AGW paradigm (Curry, 2014; Grundmann, 2011).

This author cites the Earth's solar magnetic field as instrumental in influencing global temperatures far more than CO2.
Fleming, 2018 The results of this review point to the extreme value of CO2 to all life forms, but no role of CO2 in any significant change of the Earth’s climate. … Many believe and/or support the notion that the Earth’s atmosphere is a “greenhouse” with CO2 as the primary “greenhouse” gas warming Earth. That this concept seems acceptable is understandable—the modern heating of the Earth’s atmosphere began at the end of the Little Ice Age in 1850. The industrial revolution took hold about the same time. It would be natural to believe that these two events could be the reason for the rise in temperature. There is now a much clearer picture of an alternative reason for why the Earth’s surface temperature has risen since 1850. … There is no correlation of CO2 with temperature in any historical data set that was reviewed. The climate-change cooling over the 1940–1975 time period of the Modern Warming period was shown to be influenced by a combination of solar factors. The cause of the Medieval Warm Period and the Little Ice Age climate changes was the solar magnetic field and cosmic ray connection. When the solar magnetic field is strong, it acts as a barrier to cosmic rays entering the Earth’s atmosphere, clouds decrease and the Earth warms. Conversely when the solar magnetic field is weak, there is no barrier to cosmic rays—they greatly increase large areas of low-level clouds, increasing the Earth’s albedo and the planet cools. The factors that affect these climate changes were reviewed in “Solar magnetic field/cosmic ray factors affecting climate change” section. The calculations of “H2O and CO2 in the radiation package” section revealed that there is no net impact of CO2 on the net heating of the atmosphere. The received heat is simply redistributed within the atmospheric column. This result is consistent and explains the lack of CO2 correlations with observations in the past. The current Modern Warming will continue until the solar magnetic field decreases in strength. If one adds the 350-year cycle from the McCracken result to the center of the Maunder Minimum which was centered in 1680, one would have a Grand Minimum centered in the year 2030.

Another postulates that the ACO plays a big role in climate warming/cooling cycles.
Davis et al., 2018 [T]he contemporary global warming increase of ~0.8 °C recorded since 1850 has been attributed widely to anthropogenic emissions of carbon dioxide (CO2) into the atmosphere. Recent research has shown, however, that the concentration of CO2 in the atmosphere has been decoupled from global temperature for the last 425 million years [Davis, 2017] owing to well-established diminishing returns in marginal radiative forcing (ΔRF) as atmospheric CO2 concentration increases. Marginal forcing of temperature from increasing CO2 emissions declined by half from 1850 to 1980, and by nearly two-thirds from 1850 to 1999 [Davis, 2017]. Changes in atmospheric CO2 therefore affect global temperature weakly at most. The anthropogenic global warming (AGW) hypothesis has been embraced partly because “…there is no convincing alternative explanation…” [USGCRP, 2017] (p. 12). The ACO [Antarctic Centennial Oscillation] provides a possible [natural] alternative explanation in the form of a natural climate cycle that arises in Antarctica, propagates northward to influence global temperature, and peaks on a predictable centennial timetable. … The period and amplitude of ACOs oscillate in phase with glacial cycles and related surface insolation associated with planetary orbital forces. We conclude that the ACO: encompasses at least the EAP; is the proximate source of D-O oscillations in the Northern Hemisphere; therefore affects global temperature; propagates with increased velocity as temperature increases; doubled in intensity over geologic time; is modulated by global temperature variations associated with planetary orbital cycles; and is the probable paleoclimate precursor of the contemporary Antarctic Oscillation (AAO). Properties of the ACO/AAO are capable of explaining the current global warming signal.
 
I don’t know who has a better way with words, Tony (@dsaur) or yourself? You two would do well as writers.
But regarding what you said, yes, indeed. That makes it so hard to decide what to believe. Let’s hope that old sol will have a nontrivial say so in all of this soon.
Larry,
Your compliment, if not accolade, is much appreciated, but certainly most wholly undeserved.
Tony has been for years, and remains, an aspirational goal for yours truly.
Now, if I could only figure out weather ... ;)
Best,
Phil
~~~~~~~~~~~~
P.S., This I comprehend quite well, though ... LOL ...

sfc_count_sup814_temp.gif
 
Last edited:
You always going to have deniers even when the water is neck deep and the the ice caps are collapsing. Some folks just can’t see the forest for the trees.
 
When words like "Stupid" and "Deniers" are used, that's where the conversation tends to shut down. I hope that, especially on this awesome site, this is where the civil discourse doesn't spiral out of control. Thanks ;)
 
When words like "Stupid" and "Deniers" are used, that's where the conversation tends to shut down. I hope that, especially on this awesome site, this is where the civil discourse doesn't spiral out of control. Thanks ;)

Well said, and I think there is sufficient reason for someone to say "hold the line" if someone suggests that humans are entirely responsible for a warming Earth, just as much as it is for someone to claim it isn't happening at all. Who's to say that what our current global temps are aren't the optimal temp? How do we know what the global temp SHOULD be? Small sample size is all we have (currently).
 
I completely agree. That said, I've been called worse than that and I hold two degrees in Atmospheric Science. Going against the herd isn't for the faint of heart.
Yes, when someone thinks they have a simple and only correct answer to a complex problem, name calling is usually their last resort when someone disagrees. I appreciate you willing to stand up for what your science and belief tells you 1300m, there are precious few willing to take the other side when the so called "consensus" (which is not how science is done anyway) tells them they are wrong and start to impugn their motive, intelligence or character. If we stacked up the incorrect predictions of the models and their adherents of the past 20 years to what has actually occurred, it would likely circle the entire earth. What a skeptic really means is a person who is still studying the scientific data against the predictions and trying to keep an open mind on what is causing any observed changes in our environment. Scientists who think they understand the incredible complexity of our atmosphere and how it works are dangerously delusional and should stick to observed verifiable facts instead of model output when making outlandishly incorrect predictions
 
Last edited:
You always going to have deniers even when the water is neck deep and the the ice caps are collapsing. Some folks just can’t see the forest for the trees.

You might want to read the info I posted above :) There are scientists out there who attribute the warming to other sources outside of man. Also, the climategate scandal revealed why you don’t hear much data to the contrary. Those who take natural causes as the reason for our warming are intentionally not published, blackmailed and called names. Real science always searches for every possible answer/explanation, agenda driven “science” follows the mainstream consensus and money trail. Look up climate-gate and you’ll see that pretty clearly.

Furthermore, there are hundreds of scientific papers that can be easily found which propose alternative means for the warming we’ve seen recently, outside of manmade causes. It’s also abundantly clear the scare tactics used have proven wrong time and time again. The polar bear population is stable. The Arctic and Antarctic both still have ice. Climate models have proven to be incredibly inaccurate in their predictions. Severe weather frequency has been on a downtrend in the US as has tropical activity. The list goes on and on with how wrong these climate experts have been. They try to scare people into doom and gloom and then are proven time and again to be completely wrong.

On another note, Greenland SMB is declining some with the recent blocking over that area but still is well above the 1981-2010 average.
upload_2018-8-11_18-49-12.png

Here is the gain/loss from September 2017 to now.
upload_2018-8-11_18-49-41.png
 

Attachments

  • upload_2018-8-11_18-49-3.png
    upload_2018-8-11_18-49-3.png
    87.4 KB · Views: 7
All I know, which can readily fit in a thimble and still allow room for mixer, is that yesterday a covey of mets at the NWS Jax progged a less than 10% chance of rain IMBY, and water was standing in the streets before nightfall ... go figure ...
 
Last edited:
You might want to read the info I posted above :) There are scientists out there who attribute the warming to other sources outside of man. Also, the climategate scandal revealed why you don’t hear much data to the contrary. Those who take natural causes as the reason for our warming are intentionally not published, blackmailed and called names. Real science always searches for every possible answer/explanation, agenda driven “science” follows the mainstream consensus and money trail. Look up climate-gate and you’ll see that pretty clearly.

Furthermore, there are hundreds of scientific papers that can be easily found which propose alternative means for the warming we’ve seen recently, outside of manmade causes. It’s also abundantly clear the scare tactics used have proven wrong time and time again. The polar bear population is stable. The Arctic and Antarctic both still have ice. Climate models have proven to be incredibly inaccurate in their predictions. Severe weather frequency has been on a downtrend in the US as has tropical activity. The list goes on and on with how wrong these climate experts have been. They try to scare people into doom and gloom and then are proven time and again to be completely wrong.

On another note, Greenland SMB is declining some with the recent blocking over that area but still is well above the 1981-2010 average.
View attachment 5594

Here is the gain/loss from September 2017 to now.
View attachment 5595

True Greenland ice loss was pretty normal but the rest of the sea ice is still taking a beating. The overall trend is still dropping fast. Once there is mostly open water in the Artic Sea during the melt season the Greenland Ice sheet loss will accelerate dramatically.

https://nsidc.org/arcticseaicenews/2018/08/ice-loss-speeds-up-during-second-half-of-july/


Sent from my iPhone using Tapatalk

Sea ice thickness is a much more telling tale. Things have stabilized the past 10 years and the thickness this year is comparable to 2014 and above the 2004-2013 average. To get a recovery in the Arctic you want thick ice and we are seeing that this year.
upload_2018-8-12_8-31-17.png
 
True Greenland ice loss was pretty normal but the rest of the sea ice is still taking a beating. The overall trend is still dropping fast. Once there is mostly open water in the Artic Sea during the melt season the Greenland Ice sheet loss will accelerate dramatically.

https://nsidc.org/arcticseaicenews/2018/08/ice-loss-speeds-up-during-second-half-of-july/


Sent from my iPhone using Tapatalk
You do know that the Arctic is only the Northern part (and much smaller in volume) of the globe and that there is an Antarctic also .Which btw just set an all time high for ice a couple of years ago and shows no downward trend since the satellite area began. It is no coincidence that the hemispheric ice areas tend to counter balance each other year to year, it is the Earth's way of keeping things climatologically stable. Could we be having some effect on the way it occurs? Possibly but the amount and signifigance of it is where the rub occurs
 
The problem is we are still playing it by ear instead of having control of our own climate which we may have eventually after the climate stabilizes.


Sent from my iPhone using Tapatalk
 
I agree.
The problem is we are still playing it by ear instead of having control of our own climate which we may have eventually after the climate stabilizes.


Sent from my iPhone using Tapatalk
I'm not sure what you are trying to get at. We can't just control the climate on our own. If we tried, on a global scale, the effects would likely have major consequences far worse than a slight warming of the atmosphere. We can't just stick a giant cooling system on the planet like you can put a fan or cooling system on a computer. Also, I'm not sure what will balance out the climate before any such thing could even be plausible. Sounds like a bunch of science fiction that can't happen for centuries. Unless you're suggesting some crazy idea or event that will curb the climate change which I don't exactly thing is good to consider. :confused:
 
You do know that the Arctic is only the Northern part (and much smaller in volume) of the globe and that there is an Antarctic also .Which btw just set an all time high for ice a couple of years ago and shows no downward trend since the satellite area began. It is no coincidence that the hemispheric ice areas tend to counter balance each other year to year, it is the Earth's way of keeping things climatologically stable. Could we be having some effect on the way it occurs? Possibly but the amount and signifigance of it is where the rub occurs
Not exactly true.. .there are several conflicting studies...
https://www.scientificamerican.com/article/what-to-believe-in-antarctica-rsquo-s-great-ice-debate/
https://phys.org/news/2018-03-antarctic-sea-ice-second-straight-year.html
 
I agree.

I'm not sure what you are trying to get at. We can't just control the climate on our own. If we tried, on a global scale, the effects would likely have major consequences far worse than a slight warming of the atmosphere. We can't just stick a giant cooling system on the planet like you can put a fan or cooling system on a computer. Also, I'm not sure what will balance out the climate before any such thing could even be plausible. Sounds like a bunch of science fiction that can't happen for centuries. Unless you're suggesting some crazy idea or event that will curb the climate change which I don't exactly thing is good to consider. :confused:

By controlling the amount of greenhouse gases in the atmosphere by planting trees and using other technologies to sequester carbon underground in a stable solid state (which is being tested now) or use it in manufacturing. I would think around 270 ppm CO2 should be good considering that’s where it’s been throughout most of civilization minus the last 100 years.


Sent from my iPhone using Tapatalk
 

The overall sea ice extent trend for the Antarctic is up over the past 30+ years. A warming ocean would shrink the ice extent (as we see in the Arctic) not cause it to grow.
Antarctic.JPG

Furthermore the data indicates temperatures in Antarctica are in fact cooling.
Oliva et al., 2017
http://www.sciencedirect.com/science/article/pii/S0048969716327152
“However, a recent analysis (Turner et al., 2016) has shown that the regionally stacked temperature record for the last three decades has shifted from a warming trend of 0.32 °C/decade during 1979–1997 to a cooling trend of −0.47 °C/decade during 1999–2014. … This recent cooling has already impacted the cryosphere in the northern AP [Antarctic Peninsula], including slow-down of glacier recession, a shift to surface mass gains of the peripheral glacier and a thinning of the active layer of permafrost in northern AP islands.”

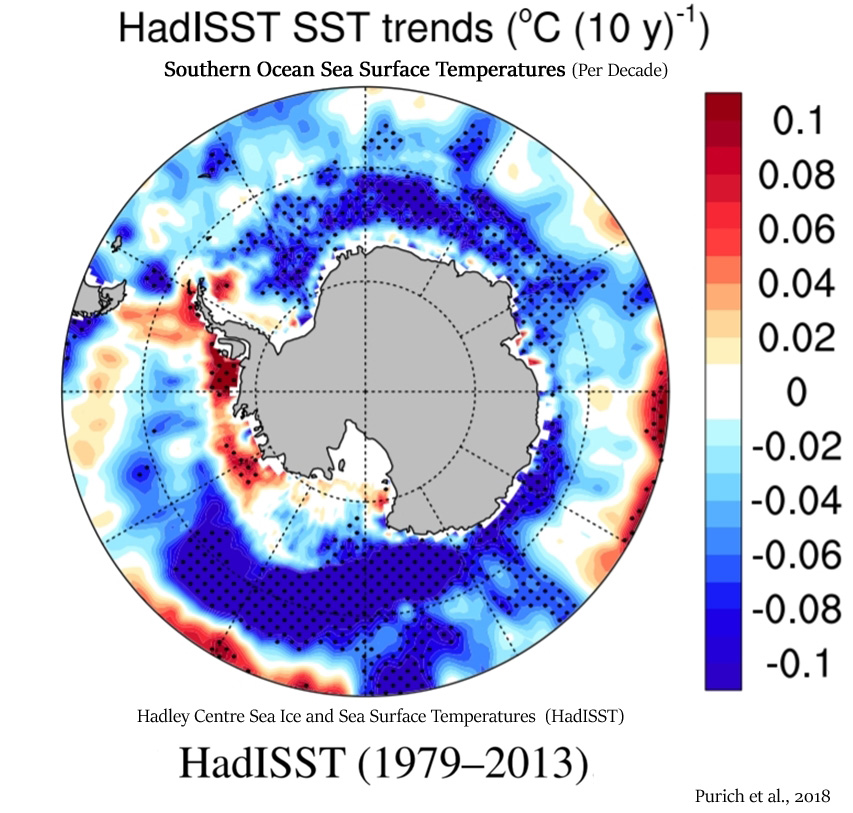
Here are Antarctic SST anomaly trends from 1979-2013, barely any warming and substantial cooling.
Southern-Ocean-Cooling-1979-to-2013-Purich-2018.jpg


From that same study, it's clear that climate models have completely missed this change. How can we trust them when they are so wrong and missing the real-time changes and observations?
Purich et al., 2018
“Observed Southern Ocean changes over recent decades include a surface freshening (Durack and Wijffels 2010; Durack et al. 2012; de Lavergne et al. 2014), surface cooling (Fan et al. 2014; Marshall et al. 2014; Armour et al. 2016; Purich et al. 2016a) and circumpolar increase in Antarctic sea ice (Cavalieri and Parkinson 2008; Comiso and Nishio 2008; Parkinson and Cavalieri 2012). … [A]s high-latitude surface freshening is associated with surface cooling and a sea ice increase, this may be another factor contributing to the CMIP5 models excessive Southern Ocean surface warming contrasting the observed surface cooling (Marshall et al. 2014; Purich et al. 2016a), and sea ice decline contrasting the observed increases (Mahlstein et al. 2013; Polvani and Smith 2013; Swart and Fyfe 2013; Turner et al. 2013; Zunz et al. 2013; Gagne et al. 2015) over recent decades. … Our results suggest that recent multi-decadal trends in large-scale surface salinity over the Southern Ocean have played a role in the observed surface cooling seen in this region. … The majority of CMIP5 models do not simulate a surface cooling and increase in sea ice (Fig. 8b), as seen in observations.”


Looking at the Arctic, people love to show the 1979-present graph from PIOMAS that shows a clear downward trend in ice extent.
BPIOMASIceVolumeAnomalyCurrentV2.1.png


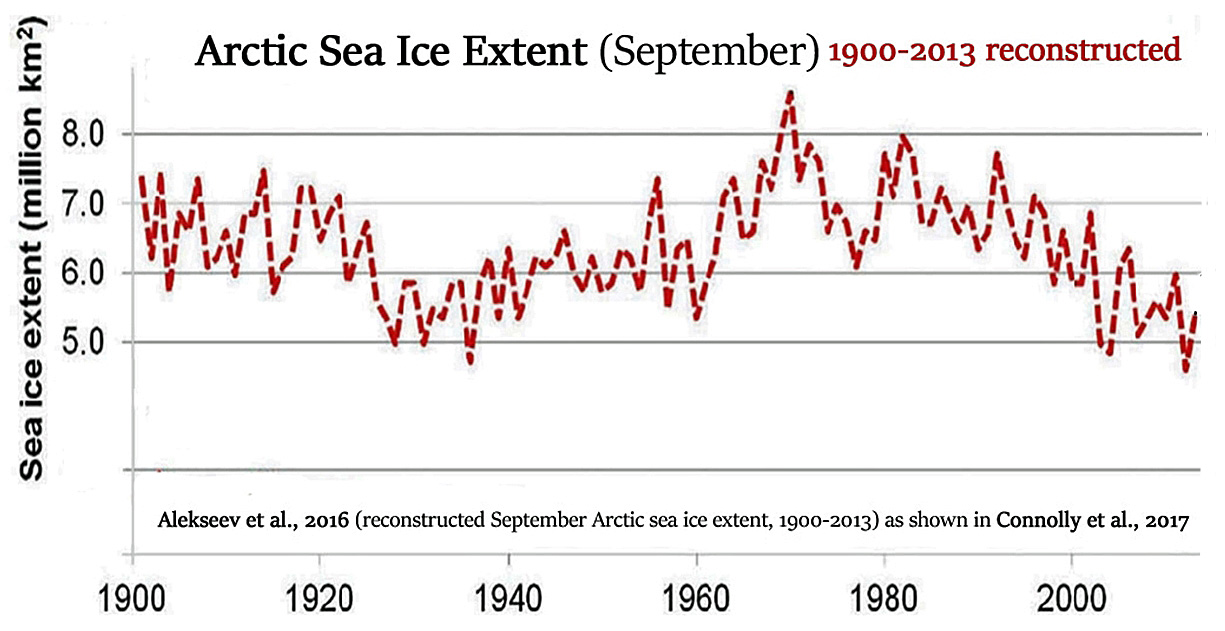
What they like to ignore is the longer term cyclic nature of the Arctic. Reconstructions over say 100 years indicate the levels we see now are not unheard of; they were seen in the 1920-1940 period before a gradual recovery. Reconstructions and other data indicate the Arctic and Antarctic have natural cycles lasting several decades (and even longer) and is within normal natural variability.
Arctic-Sea-Ice-Extent-1900-2013-Alekseev-2015-Connolly-2017.jpg


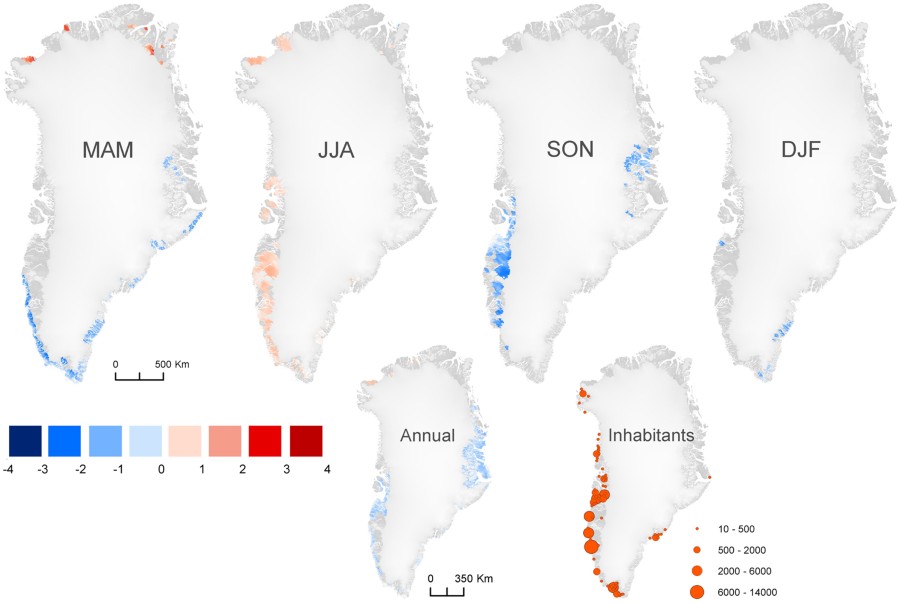
It's no coincidence that recent data indicates that not only is Greenland seeing increased SMB gain in recent years, it is also beginning to see a cooling trend.
Westergaard-Nielsen et al., 2018
“Here we quantify trends in satellite-derived land surface temperatures and modeled air temperatures, validated against observations, across the entire ice-free Greenland. … Warming trends observed from 1986–2016 across the ice-free Greenland is mainly related to warming in the 1990’s. The most recent and detailed trends based on MODIS (2001–2015) shows contrasting trends across Greenland, and if any general trend it is mostly a cooling. The MODIS dataset provides a unique detailed picture of spatio temporally distributed changes during the last 15 years. … Figure 3 shows that on an annual basis, less than 36% of the ice-free Greenland has experienced a significant trend and, if any, a cooling is observed during the last 15 years (<0.15 °C change per year).”
41598_2018_19992_Fig3_HTML.jpg
 
Thanks snowlover, you beat me to it ;)
No problem! What interests me most is how proponents of AGW must constantly twist the data analysis or come up with new ways to analyze data when it causes problems for the AGW theory.

NASA 2015: The Antarctic is gaining ice and cooling
AGW response: The data must be wrong, comes up with new theories to explain how it really is still losing ice and warming OR says the sudden cooling and ice gain is a result of a process that takes thousands of years to occur and is offsetting AGW.

Cyclic theories in the AGW paradigm are only used when it can further promote their belief system as in the example above, otherwise they throw out these cycles and look at only 20-40 years of observational data to make conclusions with the assumption that the rise in CO2 and warming must be man-made and there is no alternative explanation.

As I have posted on the past few pages, there is PLENTY of research out there which advocates for alternative views on what may be causing the warming. The reason people don't hear about them is due to the shift by the news media, social media (see YouTube recent developments on AGW) and other sources to promote AGW and blacklist/bury any alternative scientists and viewpoints. This is anti-science and embarrassing, really, to see this type of suppression going on. Here's a brief summary that was written after some additional emails were released in 2011.
(1) prominent scientists central to the global warming debate are taking measures to conceal rather than disseminate underlying data and discussions; (2) these scientists view global warming as a political “cause” rather than a balanced scientific inquiry and (3) many of these scientists frankly admit to each other that much of the science is weak and dependent on deliberate manipulation of facts and data.
https://www.forbes.com/sites/jamest...-rock-the-global-warming-debate/#3965605627ba
 
Looking at the Arctic, people love to show the 1979-present graph from PIOMAS that shows a clear downward trend in ice extent.
BPIOMASIceVolumeAnomalyCurrentV2.1.png


What they like to ignore is the longer term cyclic nature of the Arctic. Reconstructions over say 100 years indicate the levels we see now are not unheard of; they were seen in the 1920-1940 period before a gradual recovery. Reconstructions and other data indicate the Arctic and Antarctic have natural cycles lasting several decades (and even longer) and is within normal natural variability.
Arctic-Sea-Ice-Extent-1900-2013-Alekseev-2015-Connolly-2017.jpg


It's no coincidence that recent data indicates that not only is Greenland seeing increased SMB gain in recent years, it is also beginning to see a cooling trend.

41598_2018_19992_Fig3_HTML.jpg

Nice post that suggests that looking at only 1979+ in the Arctic is sort of cherry picking from a relatively high starting point. This makes me wonder, myself. There’s no question that the Arctic has warmed substantially since 1979 (though not at all in late spring and summer) and has in recent years had the largest warm anomalies in met. autumn and winter per the charts I constantly follow. But if they had been available back to 1900, what would these have shown in the other supposedly quite warm period of 1920-1940? If they were to look similarly warm to recent years, it might be “game over” for the GW alarmists. Is there any way to obtain credible Arctic SST anomalies from 1920-1940?

Regardless, I do need to ask whether or not the 1979+ map being “volume” and the 1900+ map being “extent” means too much of an apples to oranges comparison. In other words, could a 1900+ “volume” chart have looked much different from this 1900+ “extent” chart?
 
Last edited:
Nice post that suggests that looking at only 1979+ in the Arctic is sort of cherry picking from a relatively high starting point. This makes me wonder, myself. There’s no question that the Arctic has warmed substantially since 1979 (though not at all in late spring and summer) and has in recent years had the largest warm anomalies in met. autumn and winter per the charts I constantly follow. But if they had been available back to 1900, what would these have shown in the other supposedly quite warm period of 1920-1940? If they were to look similarly warm to recent years, it might be “game over” for the GW alarmists. Is there any way to obtain credible Arctic SST anomalies from 1920-1940?

Regardless, I do need to ask whether or not the 1979+ map being “volume” and the 1900+ map being “extent” means too much of an apples to oranges comparison. In other words, could a 1900+ “volume” chart have looked much different from this 1900+ “extent” chart?

When you look at the extent graphs, they show a similar result. Here is July extent trend (early September is typically the lowest point) from 1979 to 2018.
Figure3.png


Now compare with this chart which is based off September extent (lowest point for the Arctic typically). The ice extent trends are similar and show that the levels we see now are not unheard of and were experienced in the 1920-1940 period of time when CO2 was at much lower levels vs today.
Arctic-Sea-Ice-Extent-1900-2013-Alekseev-2015-Connolly-2017.jpg

Thanks. So, when looking at “extent” graphs for both periods (apples to apples), they, indeed, do match up well. However, I still wonder if “volume” was as low as it is now during 1920-40. Isn’t volume arguably the most important variable?
 
I constantly follow fantastic daily Arctic temperature anomaly charts found here (1958-present!!):

http://ocean.dmi.dk/arctic/meant80n.uk.php

It wouldn’t take long for one to look at all 60 years. If one did that, he/she would find that 1958-1979 was substantially colder than 1997+ during autumn and winter. What’s extra interesting is that 2005+ look so consistently very warm during fall/winter. It is almost as if someone flipped an extra warm switch in 2005! Then focus on 2016-18 and look at how ridiculously warm those have been during fall/winter.

Edit: note how summers always cool to near normal!

Now, if I could only be able to see similar charts for 1920-40! Would they also show these similar ridiculously warm anomalies to 2005+??
 
Last edited:
Status
Not open for further replies.
Back
Top