LickWx
Member
Fun fact: sunsets in Raleigh are now one minute later than the earliest sunset, slowly the sunset is getting later again
If you can strengthen that trough in the NE/SE Canada and get a stronger cold feed from that, then we could make that look work, all though it would still be messy. But wintry is wintry, and recent CAD events have done well in the upstateWe just suck at dropping a trough properly.
Yeah too many still frame analyses being done on a pretty garbage antecedent pattern. If it did snow, it would probably be one of those 34F snows w/ 5:1 ratios
Even that’s better than what we normally have.Yeah too many still frame analyses being done on a pretty garbage antecedent pattern. If it did snow, it would probably be one of those 34F snows w/ 5:1 ratios
Yeah too many still frame analyses being done on a pretty garbage antecedent pattern. If it did snow, it would probably be one of those 34F snows w/ 5:1 ratios
OMG< really?Fun fact: sunsets in Raleigh are now one minute later than the earliest sunset, slowly the sunset is getting later again
Dare I say it. Even cleaned out most of those annoying bed sheet size brown oak leaves that litter up a mans yard in dribble fashion all winter.Yep made some noise when it cane through, temp down to 48. 14° drop in 30 mins, not bad
Nope, the days are getting shorter till then overall but sunsets have begun getting later... its not new, you are just ill informedI thought that didn’t happen until the 21st, must be some new stuff I wasn’t aware of!
Thanks for throwing us a life raft in the midst of our ocean of despair.We doing this again? The AI runs have indeed been having this Manitoba Mauler look with closed ridge over Seattle, ridge in N Atlantic, and sharp trough in between
View attachment 155789
View attachment 155790
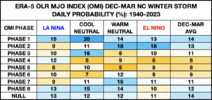
Fantastic, Webb, I am sure this took a lot of time and effort. So it looks as if going into phases 1 and 8 give better odds versus the traditional thought that phase 7 was the big ticket item, with the exception of warm neutral?Here's how the ERA-5 Outgoing Longwave Radiation (OLR) MJO Index (OMI) shakes out for NC winter storms since 1940. Looked at (& had to dig up) any winter storm that produced measurable snow east of the mountains or a glaze of ice.
First table here are the daily probabilities of a winter storm, sorted according to ENSO phase. It's actually crazy to see a 20% daily chance of a winter storm during cool neutral ENSO & phase 1 OMI (Western Hemisphere convection).
Phases 4-5-6 of the OMI MJO index tend to be unfavorable overall, while 8-1-2 are generally conducive for wintry weather.
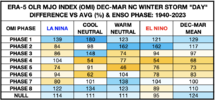
There's also some ENSO sensitivity to these favorable OMI MJO phases. Phase 1 (western hemisphere convection) is better in cold ENSO (like this year), while Phase 2 (Indian Ocean convection) is more favorable in El Niño.
View attachment 155796
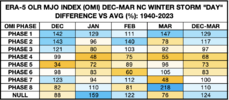
This is what the differences look like compared to climatology.
View attachment 155795
View attachment 155793
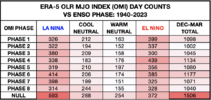
Here are the total day counts by ENSO phase:
View attachment 155794
https://psl.noaa.gov/mjo/
Fantastic, Webb, I am sure this took a lot of time and effort. So it looks as if going into phases 1 and 8 give better odds versus the traditional thought that phase 7 was the big ticket item, with the exception of warm neutral?
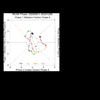
So I know there's a lag time with response to things like the NAO turning negative, etc. I'm assuming there is a lag time for the MJO as well?Well the traditional more widely known RMM MJO index and this OLR MJO index are calculated differently. This OLR MJO index relies on filtered OLR anomalies, whereas RMM relies on that and zonal low-level + upper level winds. I’d be interested to see an extension of the RMM index using ERA-5.
In any case, here’s where the OMI index was as of December 9.
Ideally, in this situation we want to get it into phase 1 in January, as this would nearly double our odds (vs normal) of seeing a winter storm, but phase 8 is also good.
View attachment 155801
So I know there's a lag time with response to things like the NAO turning negative, etc. I'm assuming there is a lag time for the MJO as well?
If memory serves, verifying colder in the long term has been the norm for this December going back to mid-November.At least we aren't torching this Christmas. Most model guidance has trended towards a pretty aggressive shot of cold air just before Christmas.

Man we gotta miss close before we hit big.
It’s the hotter version. It’s why we need that PV sagging into SE Canada. But it still gives be some December 8 2017 flashbacks
That was a miss here.It’s the hotter version. It’s why we need that PV sagging into SE Canada. But it still gives be some December 8 2017 flashbacks
I say bring it! That was a great storm for ATL if we can get that or even any good Miller A setup again. All we can do is hope the model trends line up to an actual storm vs shaft us again with too warm or dry.
If it can only come 25 more miles southeast this time. 12-8-2017 was 100% rain here.I say bring it! That was a great storm for ATL if we can get that or even any good Miller A setup again. All we can do is hope the model trends line up to an actual storm vs shaft us again with too warm or dry.
There has been a signal for this time on the models for a while now.
