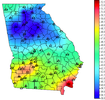
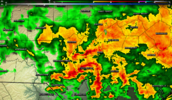
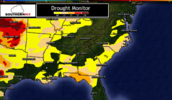
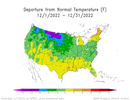
We are probably going to need a severe thread for Thursday that's a decent tornado look along and east of the tmb. Throw in a potential weak meso low...
-
Hello, please take a minute to check out our awesome content, contributed by the wonderful members of our community. We hope you'll add your own thoughts and opinions by making a free account!
You are using an out of date browser. It may not display this or other websites correctly.
You should upgrade or use an alternative browser.
You should upgrade or use an alternative browser.
Pattern Dazzling December
- Thread starter Rain Cold
- Start date
MichaelJ
Member
Is there anything more depressing and scary than mid-winter severe threats?
Reading twitter commentsIs there anything more depressing and scary than mid-winter severe threats?
We’ve got snow reports here in Fountain inn but I can confirm RAIN. Standby
Spoke to a contractor that said small flakes were flying in town earlier
bigstick10
Member
Aleutian low back is in place. Maybe we pop a +PNA again a couple of days later?


Preferably I’d like to see that much further south that where it’s currently placedAleutian low back is in place. Maybe we pop a +PNA again a couple of days later?

Avalanche
Member
Got some rain out of it. Looks like a beast in the southern coastal plain!!
Good Afternoon!!
My fellow Weather Weenies..
I woke up in a Great deal of Pain, As I've mentioned once before; Old & ongoing injuries that I have.. This Roller Coaster of Weather , temps, up & down..
troughs,
fronts..
Rumbles of Thunder in the Distance..
OH MY, I'm in a certain place, reserved in Hell for Me..
Low last night of 46F
Stright up to (currently 69F), Here on the ICW..
3/4's a inch of Precip..
Cloudly & Humid @90%
Dewpoint @ 62
Winds 17 mph outta the SSE
NCSNOW
Member
Greensboro; for December , including today will have had 18 of the 26 days so far Below Normal. Today will be the 14th day in a row Below Normal.
Im starting off today at 11 degrees at the ponderosa. Perfect Radiational cooling conditions last night. After today GSO will be averaging right at -4 BN for December.
Im starting off today at 11 degrees at the ponderosa. Perfect Radiational cooling conditions last night. After today GSO will be averaging right at -4 BN for December.
Rdu has been BN for all but 2 days since 12/12 wen warm
CHA squeezed out one last freeze this morning (low of 32) for the 7th in a row, and 12th for the month.
Gonna close out 2022 with 60 total freezes vs a long-term average (since 1879) of 59 freezes.
Gonna close out 2022 with 60 total freezes vs a long-term average (since 1879) of 59 freezes.
NCSNOW
Member
Greensboro will end December -3 Below Normal and over 4 inches of qpf(Above Normal). Coldest day netted a -25 on the means. 5 was lowest temp, and -12 coldest windchill.
And a 5-10 minute snow shower to show for it. Just goes to show once again no matter how perfect or imperfect the pattern is. Its always about timing. What makes the hobby of Frozen Precip chasing so fun. The more we know and learn, the more we realize how little we do know.
And a 5-10 minute snow shower to show for it. Just goes to show once again no matter how perfect or imperfect the pattern is. Its always about timing. What makes the hobby of Frozen Precip chasing so fun. The more we know and learn, the more we realize how little we do know.
The fog is terrible here. I can barely see a few hundred feet in front of me in some instances.
NBAcentel
Member
It’s like every new years finds a way to be wet, mild and foggy
NCSNOW
Member
Weve had it all except accumulating snow east of apps and a earthquake. Id put my money on a earthquake no matter 3 hrs or 30 days left.What's left for this thread? We only have about 3hrs to dazzle.
The only year I can think of in recent memory of a chill on New Years Eve was 2017-18It’s like every new years finds a way to be wet, mild and foggy
gawxnative
Member
Well I ust say the "patchy Fog" per FFC is some of the thicked I have ever seen . Visibility well less than 1/10th of a mile at very best...
Despite near record-breaking cold leading into Christmas weekend, December still ended up +2.6°F above normal for DFW (22nd warmest on record)...?
Avg High: 54.09
Avg Low: 34.98
Rain: 3.82
2 nights in single digits and 3 in the teens with 1/2" snow.
Avg Low: 34.98
Rain: 3.82
2 nights in single digits and 3 in the teens with 1/2" snow.
High: 52.4F
Low: 37.2F
Rain: 7.5"
Snow: T
KATL
High: 55.3F
Low: 39.8F
Rain: 3.44"
Snow: .1"
KPDK
High: 53.3F
Low: 37.2F
Rain: 5.51"
One of the three is not like the other.
Low: 37.2F
Rain: 7.5"
Snow: T
KATL
High: 55.3F
Low: 39.8F
Rain: 3.44"
Snow: .1"
KPDK
High: 53.3F
Low: 37.2F
Rain: 5.51"
One of the three is not like the other.


