• Hello, please take a minute to check out our awesome content, contributed by the wonderful members of our community. We hope you'll add your own thoughts and opinions by making a free account!

Misc 2020/21 Fall and Winter Whamby Thread

Status
Not open for further replies.
Weather Underground's 10 day actually worked out the last time.. it showed some snow for Chattanooga 8 days before it happened. So there is this tonight:

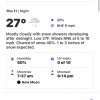
Sunday Night 01/10
32% / 0.4 in
Rain and snow showers in the evening. A snow shower or two late - otherwise, mostly cloudy. Low 32F. Winds light and variable. Chance of precip 30%. Snow accumulations less than one inch.
 
I’m a fan of your snow, you deserve to post it on the January thread to remind folks what real snow is like, not computer snow
I feel like it’s more fair to keep it in here ! I really just get excited! Every time! I’ve had 5-6 measurable snows already, and each one feels like the first event of the year, tracking, watching, I love it
 
Looks like I did pretty well I was a little concerned I might have missed a close by heavy band but even San Angelo matched Abilene I'm kind of surprised some of the totals weren't higher til you got closer to Midland off the map

I definitely want to do that again though that was the perfect way to do it lol ?

The rates were the best for sure I'm not sure I've seen rates like that the last few years

image2.png
 
As snowy as this past decade seemed compared to the previous one, it still only averaged out to roughly the historical mean:

2009-20100.00.00.00.00.00.75.31.12.90.00.00.010.0
2010-20110.00.00.00.00.02.98.51.20.0T0.0T12.6
2011-20120.00.00.00.0T0.0TTT0.00.00.0T
2012-20130.00.00.00.00.0T0.00.3T0.00.00.00.3
2013-20140.00.00.00.0T0.01.27.2T0.00.00.08.4
2014-20150.00.00.00.0T0.00.78.80.00.00.00.09.5
2015-20160.00.00.00.00.00.00.20.3T0.00.00.00.5
2016-20170.00.00.00.00.0T0.30.0T0.00.00.00.3
2017-20180.00.00.00.00.00.50.30.0T0.00.00.00.8
2018-20190.00.00.00.0T0.00.1T0.0TT0.00.1
2019-20200.00.00.00.0T0.3T2.70.00.00.00.03.0
2020-20210.00.00.00.0TTMMMMMMM
Mean0.00.00.00.0T0.41.52.00.3TTT4.1
 
Last edited:
Knoxville's past decade snowfall stats: It's amazing how 100 miles up the road in the East Tn Valley is just so much more consistent with marginal snow, year after year:

2009-20100.00.00.00.00.02.03.1T1.00.00.00.06.1
2010-20110.00.00.00.0T5.06.50.8TT0.0T12.3
2011-20120.00.00.00.00.00.1TTTT0.00.00.1
2012-20130.00.00.00.00.0T1.41.21.20.00.00.03.8
2013-20140.00.00.00.00.80.04.26.90.5T0.00.012.4
2014-20150.00.00.00.0T0.01.18.2T0.00.0T9.3
2015-20160.00.00.00.00.0T2.62.6T0.00.00.05.2
2016-2017T0.00.00.00.0T2.3TTTT0.02.3
2017-20180.00.00.0T0.00.91.7TTT0.00.02.6
2018-20190.00.00.00.0T0.31.8TT0.00.00.02.1
2019-20200.00.00.00.01.70.3T1.70.00.00.00.03.7
2020-20210.00.00.00.00.73.2MMMMMMM
MeanT0.00.0T0.31.02.21.90.2TTT5.4
 
Status
Not open for further replies.
Back
Top