Yeah I agree. This past summer wasn't that bad and this fall wasn't that warm either. I'm pretty sure 2016 was significantly warmer than 2017, or at least it felt that way to me.That's weird. Doesn't seem like it was the warmest year here. We didn't hit 90 as much as last year did all summer, but maybe it was because of the blowtorch of late winter earlier this year.
-
Hello, please take a minute to check out our awesome content, contributed by the wonderful members of our community. We hope you'll add your own thoughts and opinions by making a free account!
You are using an out of date browser. It may not display this or other websites correctly.
You should upgrade or use an alternative browser.
You should upgrade or use an alternative browser.
Pattern December, Make analogs relevant again
- Thread starter GaWx
- Start date
-
- Tags
- inspired by mack
B
Brick Tamland
Guest
I don't mind a warm Christmas as long as it's dry. I'd like to have snow, but warm and dry or cold and dry is better than rain.
Things look interesting between Christmas and the first of the new year. Just have to take the pattern and the models one day at a time now. The models have been all over the place, so really nothing is set in stone. And the weather here can change drastically in a week's time in winter, so I wouldn't worry about a warm up. We've seen it 70 here one day and a big snow storm a week later.
Things look interesting between Christmas and the first of the new year. Just have to take the pattern and the models one day at a time now. The models have been all over the place, so really nothing is set in stone. And the weather here can change drastically in a week's time in winter, so I wouldn't worry about a warm up. We've seen it 70 here one day and a big snow storm a week later.
Webberweather53
Meteorologist
That's weird. Doesn't seem like it was the warmest year here. We didn't hit 90 as much as last year did all summer, but maybe it was because of the blowtorch of late winter earlier this year.
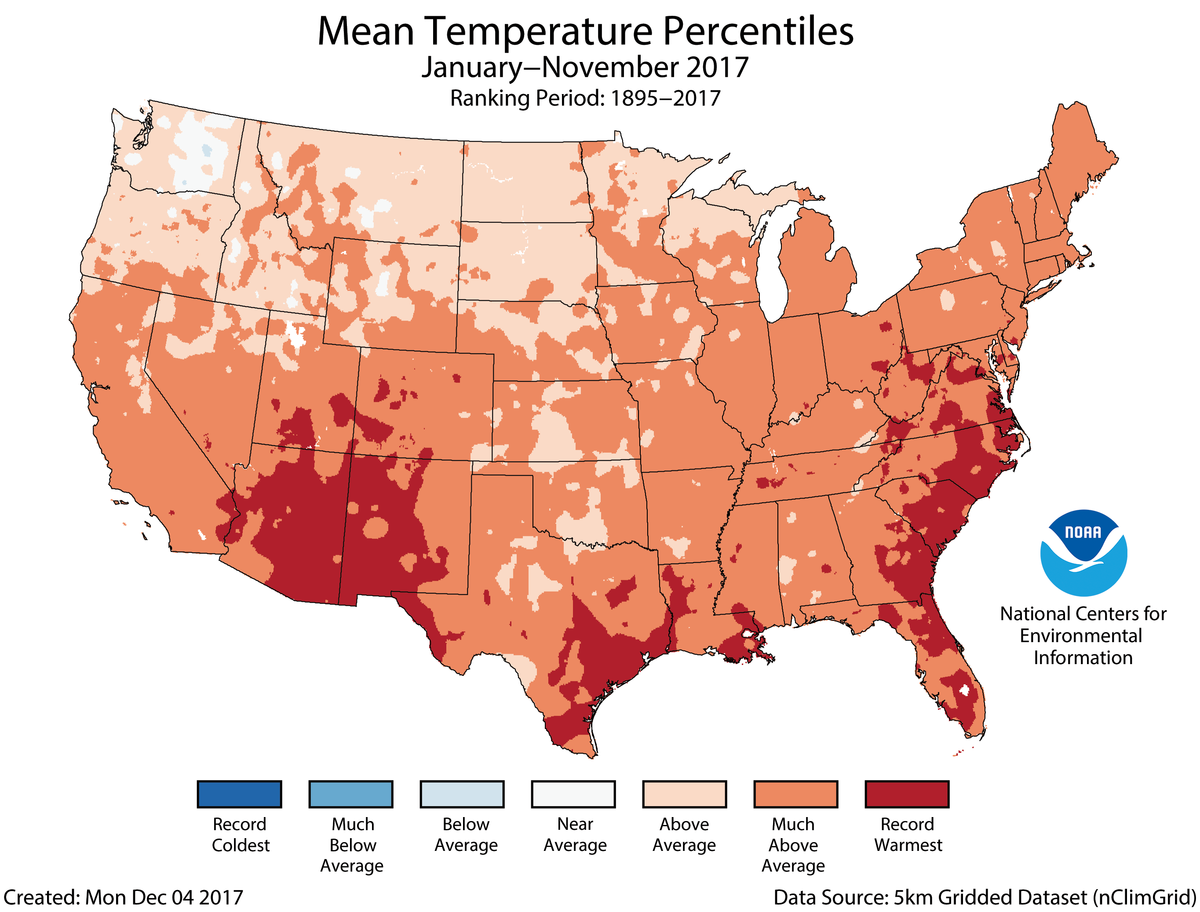
The summer was slightly below average across the TN and Mississippi Valleys but the JFM period of last winter was record or near-record warm, the spring was well above to near record warm esp in the Carolinas, and the fall was above average....
ForsythSnow
Moderator
The map Webber posted just fills in the entire state. Here is a higher resolution map for pretty much the same time period. Notice North Georgia looks way less extreme than south.Maybe it's just me, but last year as a whole seemed warmer than this year.
Webberweather53
Meteorologist
Yeah I agree. This past summer wasn't that bad and this fall wasn't that warm either. I'm pretty sure 2016 was significantly warmer than 2017, or at least it felt that way to me.
Both the summer and fall of 2016 were well inside the top 5 warmest on record, and the spring was solidly above average... It's comparable to this year for sure and in some areas it's a tad cooler but overall this year is warmer by the skin of our teeth for many
I looked at Atlanta's temps from Jan-Nov 2016 and Jan-Nov 2017 and Atlanta was about 1/2 degree cooler this year than last year.
You can probably blame last winter. Last Jan and Feb were both +9 in Atlanta. So I imagine for most areas the largest anomalies were in the winter months.Both the summer and fall of 2016 were well inside the top 5 warmest on record, and the spring was solidly above average... It's comparable to this year for sure and in some areas it's a tad cooler but overall this year is warmer by the skin of our teeth for many
ForsythSnow
Moderator
Per the high res map, Atlanta didn't have it's record highest year. Southeast GA did, so if you checked a city like Savannah, you would likely see that it had its hottest year.I looked at Atlanta's temps from Jan-Nov 2016 and Jan-Nov 2017 and Atlanta was about 1/2 degree cooler this year than last year.
It's interesting that most of the record warmest areas were in the southern half of the US. I wonder why that is ?The map Webber posted just fills in the entire state. Here is a higher resolution map for pretty much the same time period. Notice North Georgia looks way less extreme than south.
Webberweather53
Meteorologist
I looked at Atlanta's temps from Jan-Nov 2016 and Jan-Nov 2017 and Atlanta was about 1/2 degree cooler this year than last year.
Atlanta is slightly cooler this year, but last year was record warmest for them, this year, southeast GA is record warmest while Atlanta is a smidge cooler


It looks like the nation as a whole may be a little cooler this year ? It looks like more areas in the "above average" category. I don't see any areas in the "above average" category last year.Atlanta is slightly cooler this year, but last year was record warmest for them, this year, southeast GA is record warmest while Atlanta is a smidge cooler
View attachment 2095
View attachment 2096
Webberweather53
Meteorologist
It looks like the nation as a whole may be a little cooler this year ? It looks like more areas in the "above average" category. I don't see any areas in the "above average" category last year.
It's cooler but not by very much. This January-November is the 3rd warmest on record only behind last year and 2012.


ForsythSnow
Moderator
Wow that's crazy my area was way cooler than the rest of the areas around, coming in at around 23rd warmest.Here are individual station ranks for average temp.

Good news is atleast in NC GSO and espeacilly RDU seem to have turned the corner. Hopefully trend continues
RDU was BN November and currently -2.2 for December. FACT Rdu has a streak of 11 straight days at or below normal. Might squeeze out number 12 today,but it's gonna end most likely.
RDU was BN November and currently -2.2 for December. FACT Rdu has a streak of 11 straight days at or below normal. Might squeeze out number 12 today,but it's gonna end most likely.
If I remember correctly the first half of 2012 was the warmest part of that year. I remember March 2012 seemed like it felt like May or June.
B
Brick Tamland
Guest
Forget all this talk about how warm it is. Let's make this happen.

Storm5
Member
I don’t give a damn if the year is above normal. IF mby scores again before January 1 that would be twice in December. If that’s how it rolls I’ll take above normal yearly averages every single year
Is that 2 feet of snow in Upstate SC ? Looks like a wedgy look though so I'm guessing mostly ice ?Forget all this talk about how warm it is. Let's make this happen.
Who cares about the damn warmest years/winters and all that BS, just peep the GFS run that's about to hit
Storm5
Member
Incoming cold christmas for many on he 12z gfs

Sent from my iPhone using Tapatalk

Sent from my iPhone using Tapatalk
Storm5
Member
12z cmc is on board

Sent from my iPhone using Tapatalk

Sent from my iPhone using Tapatalk
Snowflowxxl
Member
Above average temps + above average snowfall = my kind of winter!!!
I might need to change my avatarForget all this talk about how warm it is. Let's make this happen.
WeatherWatch
Member
Well, this may turn out fun!


tennessee storm
Member
if you like dry cold keep it lolWho cares about the damn warmest years/winters and all that BS, just peep the GFS run that's about to hit
Webberweather53
Meteorologist
I for one would certainly not take above normal temperatures every year because eventually it will catch up with you as it progressively has done so over the course of the 20th & 21st centuries as you'd expect from the canonical Law of Averages...
Snowstorms like these put the recent event to shame esp wrt the background climatology of where they occurred...


Snowstorms like these put the recent event to shame esp wrt the background climatology of where they occurred...
Stormlover
Member
Is this still the December thread?
Your not going to get a winter storm with warm temps, so cold is all that matters, IMOif you like dry cold keep it lol
I'd rather have the cold locked in for an extended period. Eventually there will be a storm to pop up.Your not going to get a winter storm with warm temps, so cold is all that matters, IMO
Webberweather53
Meteorologist
Is this still the December thread?
Yes?!
Christmas Eve and Day, still have an interesting look on the NW fringe. Don't think it's cold chasing moisture, looks like some overrunning to me
Webberweather53
Meteorologist

WeatherWatch
Member
Yes, that's overrunning. There is a 2nd system, it's elongated and embedded just like the last winter storm.Christmas Eve and Day, still have an interesting look on the NW fringe. Don't think it's cold chasing moisture, looks like some overrunning to me
ForsythSnow
Moderator
Here's a white Christmas for some!

I work outside and this summer was actually very pleasant in SC. I would have never guessed we were on pace for this. HmmFlorida, Georgia, South & North Carolina are currently on pace for their warmest year on record. Most other states in the southern US aren't far behind, and with the exception of Arkansas and Oklahoma, every state is either warmest or top 5 warmest through November...
View attachment 2094
Flurry
Member
I'd like to cash in my chips now, pleaseHere's a white Christmas for some!
RollTide18
Member
Here's a white Christmas for some!
Thin strip of snow (or whatever) just like the last storm, just more west.
Too bad it's the GFS.
That sure is a narrow stripe of heavy snow.Here's a white Christmas for some!
We are under 7 days and have seen this show up in some form or fashion over the past few days. This could be super interesting for many areas that scored with the previous storm.
Oh what a blessing. TN valley specialHere's a white Christmas for some!