• Hello, please take a minute to check out our awesome content, contributed by the wonderful members of our community. We hope you'll add your own thoughts and opinions by making a free account!

Pattern Marvelous March

Gfs still brings a spark of precip : a cold rain/few snowflakes, trough axis has shifted west which would allow a shot for some precip here in NC, look at that low headed towards cape cod tho due to the positively tilted longwave trough moving west, if they get another suprise ima be pissed off 5E0AC607-8DC9-4601-9CB2-09C4E65CD92D.gif
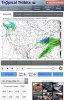
heres that energy on a z500 map which helps break out precip, also looking at soundings this is at least a little convective, not suprised but BL temps is a real struggle
B5103AD8-1604-4AC5-A52C-BAEE0FEC1EF9.jpeg6663CA7C-6C7C-4E69-BF58-13F66F311CB6.jpeg06AA5209-3995-47CF-B14F-8BEEF897C150.png
 
Lol, look at the cold on the 0Z GFS for 3/25-7 thanks to a plunging 1040 mb Arctic high. If this were real, I’d welcome it with open arms. Freezes at RDU, N ATL/Birm burbs, 40s to Orlando! Very nice.
 
The 0Z Euro is a rainstorm (no, I'm not talking about the famous poster from VA) for FL and the NC coast.
 
Gfs still shows some areas in NC may get R/S, altho light it’s something, gfs has a light setup with a positively tilted trough and NC with a w/sw flow at 500mb allowing for a little precip breaking out with decent energy based off the Z500 map, again tho BL temps are a real struggle 38878897-C776-48E4-923D-BDA4B4A23F64.gif this is the 6z
 
Im expecting us to have a full blown healthy severe weather season due to the el nino starting to take full effect on affecting our weather through the coming months.. As for as next winter goes im expecting us to have a similar year as the Atlantic coast is still warm due to the south east ridge and the models still having a hard time ironing out a forecast beyound 3 days or more... Hopefully things will change for the better concerning the next winter season...
 
Gfs still shows some areas in NC may get R/S, altho light it’s something, gfs has a light setup with a positively tilted trough and NC with a w/sw flow at 500mb allowing for a little precip breaking out with decent energy based off the Z500 map, again tho BL temps are a real struggle View attachment 17744 this is the 6z
Warm ground temps, sun angle..... don't call 911 nothing to see here. Next *sarcasm*
 
12Z EPS is not very impressive with our coastal rainstorm of 3/20-2 with most of the qpf offshore.
 
Definitely not nothing crazy, but after this cooler pattern gets shoved away gefs shows this, like I said it’s not crazy or nothing but this may need to be watched if it trends towards more of a stronger SW trough and a negative one at that, for another shot at severe wx
6183A7E3-DDFB-4778-B366-500E34C3ED9A.jpeg
 
The 18Z GFS, says, "What coastal rainstorm?" It is looking more and more like our 3/20-2 coastal rainstorm may just be a coastal ghost.
 
From Radiant this morning regarding continuing cold bias of all major models except operational GFS:

“Before discussing the model ranges for the next 15 Days, we
take a step back to show a poor performance among guidance
for the week thus far. The period from Monday to Thursday
(March 11-14) totaled 75.1 GWHDDs, which was largely warmer
than what models projected for the period in their 0z Monday
runs. The GFS OP was the best performer, being too cool by 1.0
GWHDDs; however, larger errors were recorded by our forecast
(+4.0 vs actual), the Euro OP (+5.6), Euro EN (+7.4), GFS EN
(+8.1) and CAN EN (+15.6). These errors have consideration in
our forecast going forward, which is 11.6 GWHDDs warmer
than the average of models over the next 15 Days. The 6-10
Day period totals 88.3 GWHDDs, which is warmer than the
model average (92.0), 0z GFS EN (96.5) and 0z Euro EN (93.2).
The 11-15 Day period totals 73.6 GWHDDs, which is also warm-
er than the model average (78.0), 0z GFS EN (78.9) and 0z Euro EN (83.1).”
 
With regard to our coastal rainstorm of 3/20-2, the EPS mean rainfall is very slightly further NW vs the prior run with the NW extent of the rain onshore the SE coast. However, it and the model consensus says this is still almost entirely, if not entirely, an offshore event with the best shot at light rain the south half of FL and the NC OB.
 
Who would have known we would get one more fantasy storm look in the long range ... I mean I’ll take it lol
 

Attachments

  • 3C5372E7-4E79-41BE-9ADB-BCDC3948CD35.jpeg
    3C5372E7-4E79-41BE-9ADB-BCDC3948CD35.jpeg
    765.2 KB · Views: 111
Who would have known we would get one more fantasy storm look in the long range ... I mean I’ll take it lol
6 inches of snow on March 30th.... Heck it would all be gone before lunchtime the next day. I have only seen 5 late March and early April events in my 54 years here. So, that puts the odds of a repeat at less than 10%. Of course we are reminded of that May 1992 event.
 
I guess it’s no joke, we’re gonna have to watch this time frame for severe wx, starting to look like some sort of trough is gonna setup somewhere near the SW, models have no idea on the strength of the trough but have consistently shown strong low pressure systems (below 1000) which argues for wind energy, and have shown some instability around this time frame, as we dive deeper in March into April instability becomes less of a problem aswell
B9B109B2-80E2-48E3-AA94-E762E5F29761.gif
 
If this signal is here monday morning a thread has to be started
Gfs looks a little bit worrying for this timeframe as a longwave negatively tilted trough/strong ULL will begin to pivot up at this time frame bringing up CAPE and wind energy, certainty something to watch20A49846-7129-47D7-A99C-877DF621D62F.jpeg
 
The Multivariate ENSO Index has been temporarily discontinued on NOAA ESRL:
https://www.esrl.noaa.gov/psd/enso/mei/
ts (1).png


Thus, I've spent the better part of the last week or so recreating the MEI using NCEP-NCAR Reanalysis (once again).
I've also significantly improved the navigability of my website and I've extended my analyses of individual winter storms and seasons in NC thru the winter of 1944-45. I'm really gonna try to get this winter storm archive finished by next winter but we'll see, I still have about 1,200 ish storms left to analyze.
https://www.webberweather.com/multivariate-enso-index.html
NCEP-NCAR MEI Index Timeseries (1948-Feb 2019).png
 
The Multivariate ENSO Index has been temporarily discontinued on NOAA ESRL:
https://www.esrl.noaa.gov/psd/enso/mei/
View attachment 17820


Thus, I've spent the better part of the last week or so recreating the MEI using NCEP-NCAR Reanalysis (once again).
I've also significantly improved the navigability of my website and I've extended my analyses of individual winter storms and seasons in NC thru the winter of 1944-45. I'm really gonna try to get this winter storm archive finished by next winter but we'll see, I still have about 1,200 ish storms left to analyze.
https://www.webberweather.com/multivariate-enso-index.html
View attachment 17819

The two versions of the MEI are pretty similar to one another after you corrected the ESRL MEI time series for global warming because it uses a colder, relatively more defunct 1950-1993 base period.

NCEP-NCAR vs ICOADS MEI.png
 
Back
Top