“Where” and “what”I think the question somehow is already becoming "where" and not "if"
-
Hello, please take a minute to check out our awesome content, contributed by the wonderful members of our community. We hope you'll add your own thoughts and opinions by making a free account!
You are using an out of date browser. It may not display this or other websites correctly.
You should upgrade or use an alternative browser.
You should upgrade or use an alternative browser.
Wintry January 23rd-27th 2026
- Thread starter SD
- Start date
CNCsnwfan1210
Member
Almost 100% consensus that a significant winter storm is coming.
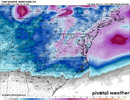
View attachment 185290
About half of them are big dogs (6in+) !
Sent from my iPhone using Tapatalk

rburrel2
Member
Did it shift way south?Oh man, I need the pretty WxNext maps from ya @bouncycorn
18z looks like a doozy
View attachment 185312

Long term WxNext trends on QPF and thermos:


The dark blue line the freezing line on this map?
Darkest blue is surface freezing line, royal blue solid line is 850hPa freezing line. Dashed line 1000-500mb thicknessesThe dark blue line the freezing line on this map?
Oh man, I need the pretty WxNext maps from ya @bouncycorn
18z looks like a doozy
View attachment 185312
I actually recently coded ZR accumulation into it! It is processing now


**Snowfall here is only counting snow, and ZR is only counting ZR.. don't have a plot for sleet, so you can fill in the gaps there.
Questions remain regarding where precip may shift to and how thermos respond, but everything is hollering mega CAD mixed bag right now. Thanks so much for these plots, they look great.View attachment 185316View attachment 185317View attachment 185318
**Snowfall here is only counting snow, and ZR is only counting ZR.. don't have a plot for sleet, so you can fill in the gaps there.
I would just say that even if you have the good players on the field - retrograding Greenland block, low anomaly underneath, etc, it still comes down to the specific details on where those features are located, how they evolve, and how they interact with the storm wave moving in from the SW. A lot of the good storms that hit the Mid-Atlantic and the Northeast also have these features of course, there're just a little farther north when those areas get hit good compared to what we requireSeems like it would be really hard for models to trend stronger with the SE ridge here. You have a perfectly placed block with a polar vortex trapped directly in between it and the southern Atlantic coast. If anything, I’m shocked there can be as much ridging as what’s being shown?
Doesn’t this usually trend towards less ridging, when you have the the players lined up like this?
2m temperature during the peak of the precip

How reliable is the google model? It have a good track record?2m temperature during the peak of the precipView attachment 185320View attachment 185321
Statistically, it is the best model around. That is based on validation that spans multiple years (2022 to present).How reliable is the google model? It have a good track record?
It was stellar during hurricane season (even, surprisingly, with cyclone intensity!).
How well it does with specific situations is TBD. It is experimental and not publicly available.
iwantsouthernsnow123
Member
Is there a 925 and 850 and 700mb temp on there?2m temperature during the peak of the precipView attachment 185320View attachment 185321
Had ChatGPT make it into a snowfall map. Dunno if that’s reliable enough.2m temperature during the peak of the precipView attachment 185320View attachment 185321

Is there a 925 and 850 and 700mb temp on there?


I haven't put a lot of time into those specific plots, so the colormaps are a bit weird.
Stormlover
Member
Would a 850 mb temp above freezing and a 925 mb temp below freezing, as well as the surface, likely mean sleet?
really interesting that this ai model displayed the exact same lurch upward in qpf the ai ero ens showed over the last two model cycles
The CAD in Georgia seems rather anemic as depicted by the model. Just doesn't have that classic tongue of cold air sharply into Atlanta and points north and east. I'm still trying to get used to these new Al models. I presume details are smoothed a bit?2m temperature during the peak of the precipView attachment 185320View attachment 185321
If you watch them both closely they are often pretty much right with each other. Did @bouncycorn say they run off the euro IC?really interesting that this ai model displayed the exact same lurch upward in qpf the ai ero ens showed over the last two model cycles
Yes, most likely sleet. Or at least a rain/sleet mix.Would a 850 mb temp above freezing and a 925 mb temp below freezing, as well as the surface, likely mean sleet?
They initialize with the same initial conditions, have the same training data (ERA5 since 1980), and very similar model architectures (CRPS-optimized GNN-Transformer ensemble, difference is AIFS-ENS injects high dimensional noise across the model while WeatherNext2 injects low dimensional noise across the model.. WxNext2 noise injection is the better method in testing)really interesting that this ai model displayed the exact same lurch upward in qpf the ai ero ens showed over the last two model cycles
View attachment 185316View attachment 185317View attachment 185318
**Snowfall here is only counting snow, and ZR is only counting ZR.. don't have a plot for sleet, so you can fill in the gaps there.
Valid question IMHO. Assuming 10:1 ratios (as shown) - given the cold projected, is 15:1 or even 20:1 possible? My guess is its too early to know?
ok makes total sense. really enjoyed picking your brain about these things last few daysThey initialize with the same initial conditions, have the same training data (ERA5 since 1980), and very similar model architectures (CRPS-optimized GNN-Transformer ensemble, difference is AIFS-ENS injects high dimensional noise across the model while WeatherNext2 injects low dimensional noise across the model.. WxNext2 noise injection is the better method in testing)
bncho
Member
From one of my friends in AmericanWX:Valid question IMHO. Assuming 10:1 ratios (as shown) - given the cold projected, is 15:1 or even 20:1 possible? My guess is its too early to know?
"There can be periods of high ratio snow most commonly on the backside or an upper level low pass but the front side is usually 10:1 or less. It's humid here and that matters. Getting pristine snow growth for long durations is also hard for multiple reasons. We always get periods of plates and mangled flakes even when it's a clean all snow event.
IMO, sticking to the basic 10:1 ratio when the ground and column is cold is the most accurate."
I pressed a random point in North Carolina on OpenSnow (company I work for) and it has ratios around 14:1 to 15:1. We have a very strong algorithm for calculating snow ratio.Valid question IMHO. Assuming 10:1 ratios (as shown) - given the cold projected, is 15:1 or even 20:1 possible? My guess is its too early to know?

i've always thought thinking about this stuff at this point in the event is getting greedyValid question IMHO. Assuming 10:1 ratios (as shown) - given the cold projected, is 15:1 or even 20:1 possible? My guess is its too early to know?
Ask away. Love explaining these things as many/most meteorologists don't understand them well. I spoke at a meteorologist conference last week in Tahoe about AI-weather and speaking at one this week in Colorado. All about these models (and more!).ok makes total sense. really enjoyed picking your brain about these things last few days
i've always thought thinking about this stuff at this point in the event is getting greedy
Thank you, Ross. I was simply trying to understand this newer methodology. Please forgive me if I was coming across as greedy.


Maybe SouthernWx needs a Youtube video, question and answer session with you about AI-weather.Ask away. Love explaining these things as many/most meteorologists don't understand them well. I spoke at a meteorologist conference last week in Tahoe about AI-weather and speaking at one this week in Colorado. All about these models (and more!).
rburrel2
Member
Is that freezing rain map you made a stock qpf below 32? Or is it trying to factor in temps/rain rates/runoff/etc?Ask away. Love explaining these things as many/most meteorologists don't understand them well. I spoke at a meteorologist conference last week in Tahoe about AI-weather and speaking at one this week in Colorado. All about these models (and more!).
QPF below 32F from period start to finish. weathernext2 (and other models) provide QPF total over 6 hour windows but temp at the times themselves, so if the ptype is ZR at start and end, it is counted. I reduce the ratio from 1:1 when either the start is above freezing or end is above freezing. And keep in mind, weathernext is an ensemble of 64 members, so we do this for each member and plot the mean.Is that freezing rain map you made a stock qpf below 32? Or is it trying to factor in temps/rain rates/runoff/etc?
haha didn't mean to come across as snide. but even with the signal, beginning to talk ratios to me is ultimate hubris for a storm 6 days awayThank you, Ross. I was simply trying to understand this newer methodology. Please forgive me if I was coming across as greedy.
there any good articles, journals, reading material you can recommend about this stuff?Ask away. Love explaining these things as many/most meteorologists don't understand them well. I spoke at a meteorologist conference last week in Tahoe about AI-weather and speaking at one this week in Colorado. All about these models (and more!).
Interesting shift by the ICON at hour 102. Pulling the Baja energy further east

1046 dropping into North Dakota on the Icon some serious cold air on tap here guys.

Tsappfrog20
Member
Interesting shift by the ICON at hour 102. Pulling the Baja energy further east
View attachment 185332
Is that good or bad
Sent from my iPhone using Tapatalk