-
Hello, please take a minute to check out our awesome content, contributed by the wonderful members of our community. We hope you'll add your own thoughts and opinions by making a free account!
You are using an out of date browser. It may not display this or other websites correctly.
You should upgrade or use an alternative browser.
You should upgrade or use an alternative browser.
Misc General Banter Thread
- Thread starter Rain Cold
- Start date

He posts a lot about the people in charge manipulating the models to show warm to influence the NG markets. Solid conspiracy guy.Saweet, I guess! lol I wonder how it has been doing?
Thanks, that's good to know. I feel there is a lot out there that does that!He posts a lot about the people in charge manipulating the models to show warm to influence the NG markets. Solid conspiracy guy.
That’s definitely true. I guess the deeper question is: does the 540 thickness line mean the same today as it did 50-75 years ago, in that more variables have to fall in place now for it to be the (relatively) true rain/snow changeover line because of how average 500 mb heights for, say 40° north, over North America during DJF have steadily risen overall since the 1960s for all of mid latitude CONUS. In other words, what used to be the upper air norm is not normal now.
Ethan,
Along with warming avg sfc temps, things like avg 850 mb temps and avg 500 mb have also risen. Related to this, I’d think that avg thicknesses have also risen. So, I assume that it’s harder to get a sub 540 dm thickness than it was when the globe was cooler.
But, is it actually harder for it to snow given a 540 thickness? I haven’t read anything clearly saying that. So, perhaps not. It’s just that 540 thickness lines are apparently creeping a bit further north as the earth continues to warm.
Here’s a link to an article that I found interesting:
The 540 Line: A Rule Of Thumb Meteorologists Use To Determine The Snow Versus Rain Line
Here's a little winter weather forecasting 101 on a general rule of thumb meteorologists use for the rain versus snow line.
wu-next-prod.wunderground.com
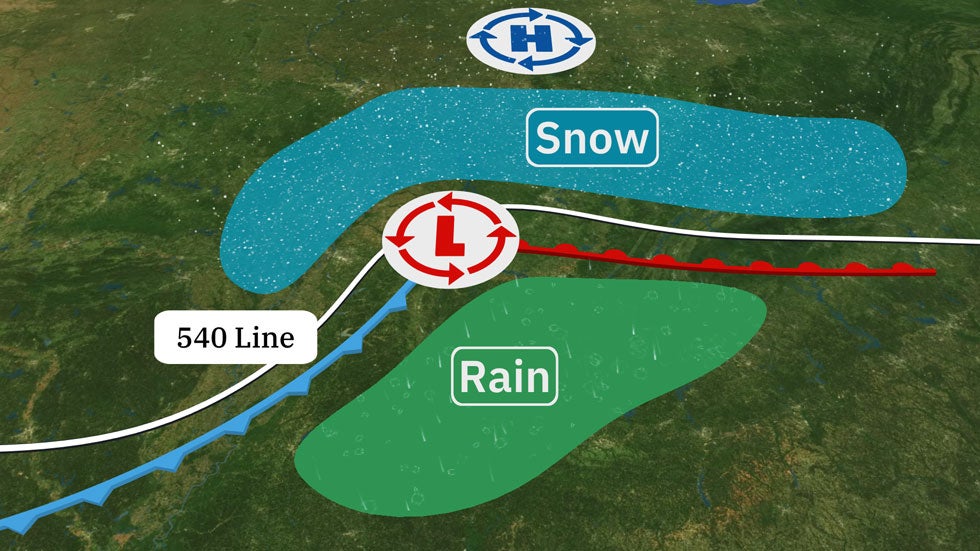
The model forecast map below shows the 540 line draped just south of the Great Lakes on the morning of Monday, Oct. 14. But in most of those areas outside of higher terrain, rain instead of snow was falling.
That's because despite the thickness of the atmosphere being ripe for snow well above the ground by hundreds or thousands of feet, the air located near the surface where we live was too mild, or warmer than 32 degrees, meaning the snowflakes melt into raindrops. This can often happen both early in the fall and later in spring when the source of cold air is modest, but we even see this in midwinter on occasion.
So while the 540 line is a good first stab at determining the rain versus snow line, meteorologists don't stop there. They often look at several other model forecasting charts to further hone in on where snow versus rain will occur.
Not to add confusion, but my observations for the SE have actually told me that the 546 thickness is often a better rain/snow line indicator in mid-winter than 540! Also, I prefer to use the 0C 850 mb line if precip is steady enough.
Iceagewhereartthou
Member
Excellent synopsis and link, thank you for that.Ethan,
Along with warming avg sfc temps, things like avg 850 mb temps and avg 500 mb have also risen. Related to this, I’d think that avg thicknesses have also risen. So, I assume that it’s harder to get a sub 540 dm thickness than it was when the globe was cooler.
But, is it actually harder for it to snow given a 540 thickness? I haven’t read anything clearly saying that. So, perhaps not. It’s just that 540 thickness lines are apparently creeping a bit further north as the earth continues to warm.
Here’s a link to an article that I found interesting:
The 540 Line: A Rule Of Thumb Meteorologists Use To Determine The Snow Versus Rain Line
Here's a little winter weather forecasting 101 on a general rule of thumb meteorologists use for the rain versus snow line.wu-next-prod.wunderground.com
The model forecast map below shows the 540 line draped just south of the Great Lakes on the morning of Monday, Oct. 14. But in most of those areas outside of higher terrain, rain instead of snow was falling.
That's because despite the thickness of the atmosphere being ripe for snow well above the ground by hundreds or thousands of feet, the air located near the surface where we live was too mild, or warmer than 32 degrees, meaning the snowflakes melt into raindrops. This can often happen both early in the fall and later in spring when the source of cold air is modest, but we even see this in midwinter on occasion.
So while the 540 line is a good first stab at determining the rain versus snow line, meteorologists don't stop there. They often look at several other model forecasting charts to further hone in on where snow versus rain will occur.
Not to add confusion, but my observations for the SE have actually told me that the 546 thickness is often a better rain/snow line indicator in mid-winter than 540! Also, I prefer to use the 0C 850 mb line if precip is steady enough.
Lol Bastardi just replied to my post on X
LukeBarrette
im north of 90% of people on here so yeah
Meteorology Student
Member
2024 Supporter
2017-2023 Supporter

Big time pattern producing some big time rain
The only pixel of frozen is on top of your house so this 100% gonna verifyView attachment 181692
Big time pattern producing some big time rain
Well yall have been praying for El Niño. Here you go. Consider the drought busted. Enjoy your cutters and rain. Bluegill on the bed by mid February 

NBAcentel
Member
next week is gonna be a miller A rainstorm, at least we’re stepping down from cutters
LukeBarrette
im north of 90% of people on here so yeah
Meteorology Student
Member
2024 Supporter
2017-2023 Supporter
Thoughts on mountains possibly getting a paste? Certainly possible in my eyesnext week is gonna be a miller A rainstorm, at least we’re stepping down from cutters
JHS
Member
The 6z GFS does not have anything next week. Very dry through hour 288 on it east of the mountains. A 1986 repeat is very much in play.next week is gonna be a miller A rainstorm, at least we’re stepping down from cutters
That was my first thought at first also, but I don't think it's as bad as it seems after going over everything. I THINK we are fine man. Let's see how today goes.Back to square one I see.
If this is just a “waffle” back and forth kind of thing I would expect to see some more fantasy runs at some point today. Let’s hope.That was my first thought at first also, but I don't think it's as bad as it seems after going over everything. I THINK we are fine man. Let's see how today goes.
Brent
Member
Of all years haha it just happens to be the most historic February ever here 
Snowman63
Member
Feb, 2021 redux incoming?Of all years haha it just happens to be the most historic February ever here View attachment 181708


tennessee storm
Member
Then it’s back to cutters at months end. Pna back negativenext week is gonna be a miller A rainstorm, at least we’re stepping down from cutters
tennessee storm
Member
Crappie on bed same time also .Well yall have been praying for El Niño. Here you go. Consider the drought busted. Enjoy your cutters and rain. Bluegill on the bed by mid February
Brent
Member
Feb, 2021 redux incoming?
I mean I'm convinced something wintry happens here eventually but I dunno about that

I just can't believe of all the years
SnowNiner
Member
Starting to not be a fan of the pattern coming up. It's just not cold for MBY. Cold is bottled up NW. Tilt of the western ridge, etc, it's just not flowing the cold into the SE. Patiently waiting for models to show cold.

The models have been showing cold lol. It’s just bouncing around like it always does. We will focus in on some threats by weekends end.Starting to not be a fan of the pattern coming up. It's just not cold for MBY. Cold is bottled up NW. Tilt of the western ridge, etc, it's just not flowing the cold into the SE. Patiently waiting for models to show cold.
View attachment 181717
Drizzle Snizzle
Member
I mean that was only 5 years ago. It’s not like 2021 was a long time ago.Of all years haha it just happens to be the most historic February ever here View attachment 181708
Snowking2.0
Member
Bad trends again wash rinse repeat man i need a beer
Let's just go to the mountains. Rent a cabin that will fit all of us. 
Drizzle Snizzle
Member
I don't remember a storm around MLK Day in 2017 but I do remember North Georgia getting a few inches of snow on Jan 6-7, 2017 !I think next Thursday could turn into something. Need that baby to dig a little more. We got our cold coming in. Several systems have potential and we're in prime climo. I remember January 2017 was looking grim and then we got that storm around Martin Luther King Day. I believe good times are ahead.
My bad I got my dates mixed up.I don't remember a storm around MLK Day in 2017 but I do remember North Georgia getting a few inches of snow on Jan 6-7, 2017 !
Thank you! That's great data. This literally is why "it don't snow like it used to". lol. But yeah, we're not imagining things when we say snow was better back when we generation x'ers were kids because the tropical forcing was better it seems.
I think to fix this we need to get together and dump a bunch of ice in the West Pacific Warm Pool, likely causing alot of this.
A few years ago I suggested SouthernWx sponsor a member cruise to the W Pac warm pool, provide tons of ice, and let us all dump a bunch of ice there. Maybe we can see if @Jimmy Hypocracy will provide his fail-boat for the cruise.
I got you!A few years ago I suggested SouthernWx sponsor a member cruise to the W Pac warm pool, provide tons of ice, and let us all dump a bunch of ice there. Maybe we can see if @Jimmy Hypocracy will provide his fail-boat for the cruise.

LukeBarrette
im north of 90% of people on here so yeah
Meteorology Student
Member
2024 Supporter
2017-2023 Supporter
LETS GOOO MITCH
I like the mega phase option. Everybody gets snow or everybody gets rain. Only fair 
 ️
️
️nice cold spotty rain on the day 10 system from the gfs 
“It just shows the potential”gfs is the worst model in the world and sucks and should be left out in a field to die and is a synecdoche for american deterioration until it shows a good snow

Drizzle Snizzle
Member
Do they even have hotels in Moyock ?Book your hotels in Moyock ASAP.
They have igloosDo they even have hotels in Moyock ?
The southern jet is waking up.It's been so dry lately in most of the south, and this next rainmaker is going to be mostly dry east of the Apps. What makes you think that all of a sudden when it gets cold that the moisture is going to return ? We can't even get moisture when its warm !
If only it were January……
I’m a snow weenie and optimist but it’s always the end of the runs dropping the cold! Unleash the cold !!!!
that backend dusting gonna be hard to drive in MackIf only it were January……View attachment 181779