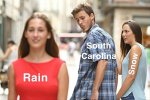
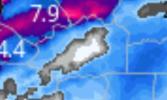
Ah, yes, the ole SLP track from offshore of ILM to on top of RDU while bombing to 977 mb…classic. Definitely a realistic setup! ?Found the culprit! ??View attachment 101153View attachment 101154
-
Hello, please take a minute to check out our awesome content, contributed by the wonderful members of our community. We hope you'll add your own thoughts and opinions by making a free account!
You are using an out of date browser. It may not display this or other websites correctly.
You should upgrade or use an alternative browser.
You should upgrade or use an alternative browser.
Misc 2021-22 Fall/Winter Whamby Thread
- Thread starter jackendrickwx
- Start date
I’ve seen 20 several times, but never 50 since I’ve been keeping track the past three years.I figure it’s happened at some point before, but I don’t think I’ve personally witnessed a model spitting out 50” on the clown in central NC.
Yep, I’ve seen well into the 30”s before, but I can’t remember anything over 40”. Then again, these days I try to avoid looking at the long range modeling as it's hazardous ro my health!I’ve seen 20 several times, but never 50 since I’ve been keeping track the past three years.
GeorgiaGirl
Member
Whew that run.
Good example of why things past about hour 240 are for your entertainment.
Good example of why things past about hour 240 are for your entertainment.
NoSnowATL
Member
BooView attachment 101148New Profile Pictures?
NoSnowATL
Member
Not enough for my location. We toss again. #HateNCAgain
Right...but that is a great sign of some type of Winter storm for the southeast. I will take my 4 inches and be happy!Whew that run.
Good example of why things past about hour 240 are for your entertainment.
Who is posting for dadofjax??
NoSnowATL
Member
I would definitely take a trip to NC for that big dog.
Dewpoint Dan
Member
his 8 year old son ?Who is posting for dadofjax??
Storm5
Member
I see the ludicrous predictions have started . I'm here for the comments now
Sent from my iPhone using Tapatalk
Sent from my iPhone using Tapatalk
Dewpoint Dan
Member
2-4" for youI see the ludicrous predictions have started . I'm here for the comments now
Sent from my iPhone using Tapatalk
Stephenb888
Member
Honestly I don’t know why any of us from SC are on this forum. The mountains just work against us and there really is no hope.
No it's not.Right...but that is a great sign of some type of Winter storm for the southeast. I will take my 4 inches and be happy!
Weather looks amazing in Buffalo right now
LickWx
Member
Uhmmm did you see me and metwannabe ? We get like 2 inches in this . Everyone’s banned if that happens .There will still be complaints about the gfs run
597DM
Member
Less snow, more snow
Oh no, let's go
Hrrr is great, rap is crap
The accumulations are looking fine
In my weenie mind
Oh no, let's go
Hrrr is great, rap is crap
The accumulations are looking fine
In my weenie mind
B
Brick Tamland
Guest
9 degrees in Green Bay at kickoff today.Weather looks amazing in Buffalo right now
?????Less snow, more snow
Oh no, let's go
Hrrr is great, rap is crap
The accumulations are looking fine
In my weenie mind
We finally got some real football weather9 degrees in Green Bay at kickoff today.
B
Brick Tamland
Guest
I would be estatic just seeing some snow falling tomorrow after it being 80 degrees just 48 hours before.
The ground temp crowd is about like the climate change crowd. You ain’t changing how somebody feels no matter what physical evidence is shown.
Montanasnow30
Member
For all my Alabama folks good luck on the snow today you guys deserve it I’m even excited for my family members down in Huntsville and especially Birmingham
Montanasnow30
Member
@Parker hey buddy I’m happy that y’all in Birmingham are about to see some flakes fly bring it home and good luck on the snowThe ground temp crowd is about like the climate change crowd. You ain’t changing how somebody feels no matter what physical evidence is shown.
If I turn the burner on my stovetop on high for 10 days, turn it off for 24 hours, then pour a bag of ice on top of it, the fact that it was 300 degrees just 24 hours before has no bearing on the matter at hand.
NoSnowATL
Member
You must be rich. 10 straight days = ?If I turn the burner on my stovetop on high for 10 days, turn it off for 24 hours, then pour a bag of ice on top of it, the fact that it was 300 degrees just 24 hours before has no bearing on the matter at hand.
But stoves are designed so that heat isn't insulated when the burner is turned off. The earth on the other hand has a greater specific heat where it takes a lot of energy, or loss thereof to create a change. I don't see how your point would make sense with the context of this storm.If I turn the burner on my stovetop on high for 10 days, turn it off for 24 hours, then pour a bag of ice on top of it, the fact that it was 300 degrees just 24 hours before has no bearing on the matter at hand.
It was admittedly a bit hyperbolic. Obviously if soil temps are hovering around freezing then snow/ice is going to stick quicker. But it’s the last thing southern snow lovers should ever worry about. Lots of other real atmospheric conditions working against us.But stoves are designed so that heat isn't insulated when the burner is turned off. The earth on the other hand has a greater specific heat where it takes a lot of energy, or loss thereof to create a change. I don't see how your point would make sense with the context of this storm.
NoSnowATL
Member
I hate that all 47 snow flurries will fall over night while I’m sleeping. Darn.
I've never experienced accumulation with a warm ground; however, I know many have especially in December 2017. We shall see.It was admittedly a bit hyperbolic. Obviously if soil temps are hovering around freezing then snow/ice is going to stick quicker. But it’s the last thing southern snow lovers should ever worry about. Lots of other real atmospheric conditions working against us.
NoSnowATL
Member
93 vibesI've never experienced accumulation with a warm ground; however, I know many have especially in December 2017. We shall see.
NBAcentel
Member
Soil temps/marginal temps and bad ratios killed it last winter for me twice with heavy snow falling but we’ll see this time
Yes, bad soil temps and above freezing BL temps absolutely can kill marginal events. Last year’s storm was hampered by this, as was February 2020’s storm. I don’t know why people dispute the impact when the professional meteorologists discuss it during forecasts and case studies. It’s one factor of many, but you better believe it has an impact and should make one be very cautious with the clown maps in a situation like this.Soil temps/marginal temps and bad ratios killed it last winter for me twice with heavy snow falling but we’ll see this time
The difference between snow falling at 20F and snow falling at 33F with days of 70F before it is mind-blowing. I love cold storms. It makes a big difference.
And you were there for the first debate!
LukeBarrette
im north of 90% of people on here so yeah
Meteorology Student
Member
2024 Supporter
2017-2023 Supporter
Going to be up at 4 am tomorrow to record the changeover. It’s going to be 2+ inches per hour when it switches so I gotta be up to see it.


