Continued from my prior post…..
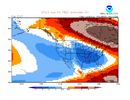
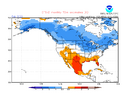
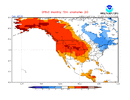
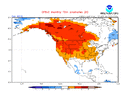
2017: 3% of CONUS BN; BN E Can
View attachment 199048
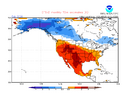
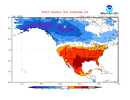
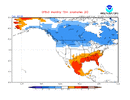
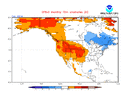
2016 (
Nino): 4% of CONUS BN; AN E Can
View attachment 199049
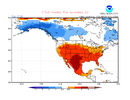
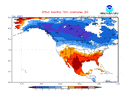
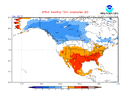
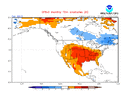
2015 (
Nino): 0% of CONUS BN; BN E Can
View attachment 199050
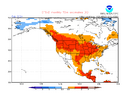
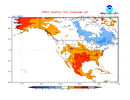
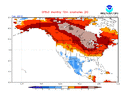
2014: 4% of CONUS BN; BN E Can
View attachment 199051
2013: 1% of CONUS BN; BN E Can
View attachment 199052
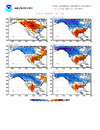
2012: 15% of CONUS BN; BN E Can
View attachment 199053
———————————
Feb: % BN Conus; E Can anom
‘27 (
Nino): 80% BN US; much AN E Can
’26: 1% BN US; BN E Can
’25: 0% BN US; BN E Can
’24 (
Nino): 0% BN US; AN E Can
’23: 33% BN US; BN E Can
’22: 6% BN US; BN E Can
’21: 20% BN US; BN E Can
’20: 1% BN US; BN E Can
’19 (
Nino) 5% BN US; BN E Can
’18: 20% BN US; BN E Can
’17: 3% BN US; BN E Can
’16 (
Nino): 4% BN US; AN E Can
’15 (
Nino): 0% BN US; BN E Can
’14: 4% BN US; BN E Can
’13: 1% BN US; BN E Can
’12: 15% BN US; BN E Can
—————————————
Analysis of above:
-Feb of ‘27 80% BN US vs only 33% (‘23) for next closest! Avg of only 7.5% BN US for 2012-26 and a mere 2% BN for the four El Niño cases!
-The other 4 Nino Febs had no more than 5% BN US! The two strongest Nino Febs had US BN of 0% (‘24) and 4% (‘16)! So, there’s virtually no resemblance to ‘27.
-BN in the SE US virtually nonexistent on any of 2012-2026 with most of them mild. But in stark contrast, 2027 has a very cold SE!
-Feb of ‘27 has by far the warmest E Can. Only 2 others had any degree of AN (much less intense than ‘27) and they were the 2 strongest El Niños (‘24 and ‘16).
——————
In closing, Feb of ‘27 has been very persistently (for 2 months!) showing on the CFSv2 a highly unique (among all Febs on record) extreme couplet of a cold dominant CONUS and extreme blocking/very warm E Canada. The CFSv2 has been trying to tell us something it never has and though I’m not at all saying to trust it, I am suggesting that it not be dismissed.



 Somewhat bullish for Charlotte!