Drizzle Snizzle
Member
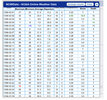
I guess the snow and cold skipped Atlanta because Atlanta had normal temps and only 1/2” of snow in January 2022.The image below is how it looked for Jan 2022 at this time, when instead of one of the coldest week 3-4 outlooks on record for the SE half of the US like was the case for Jan of 2025, it was suggesting that a mild SE half of the US was a much better possibility. This is when there was a similar very strong -PNA to what’s being forecasted for late Dec:
View attachment 179308
How did Jan 8-21, 2022 verify in Greensboro, NC? They ended up 4 BELOW normal and had two 1”+ snowfalls. So, one would have had no clue from NOAA even as late as Dec 24th of 2021 that a cold and snowy Jan of 2022 in much of the E US was incoming. The point is that sometimes the extended models don’t have a clue.