Well as far as as skeptics about AGW it all depends on your news source. Of course both right and left leaning sources are going to put out information that supports their point of view. Of course the media will put out whatever info gets them the most “hits” so it’s not going to ever be balanced either way. I never argued any single weather event supported or denied AGWs existence, lots of media puts out skeptical articles when we do we have abnormal cold shots as well. Just saw the article on Trump’s statement, brand new of course, but a change from what I quoted earlier. Of course no one on either side is advocating trillions of dollars or millions of jobs, but I guess I’m glad he’s at least discussing it. Nice discussing this with you, and will in the future, although it seemed you addressed a lot of my points other than my main premise regarding risk/ benefit analysis with the science at hand. Can’t say I have a lot of time to continue this debate with you, but I hope Americans can have more civil discourse in general like this.Still the question is unanswered, what cleaner, cost effective and efficient fuel source is their for the millions of trucks and cars all over the world? What reliable fuel source is their for power plants that isn't highly disputed like nuclear energy is? Sure there is plenty of research going on in various market sectors for alternative energy methods but until something viable to meet these needs is released then fossil fuels will continue as the primary source of power. Businesses are free to research and explore alternative methods of power there is nothing holding them back from doing so regardless of whether AGW is real, natural or something in between.
I think the media has made it abundantly clear that AGW is real (in their view) and have gone out of their way to promote this. Every single time there is a natural disaster or brutal heat wave you hear the media claiming it's all due to global warming and climate change. People have heard plenty on it so lack of information is not the problem. If anything I would add that people aren't hearing the skeptical side of the debate and only the AGW side. When was the last time you heard a news article discussed on a main news website/tv station that endorsed or presented the skeptical side of things? Do a google search on global warming and you'll quickly find all the top hits are in favor of AGW. That's far from a balanced scientific view into the climate change discussion since there are some incredibly smart people on BOTH sides of this debate but only one side is promoted...
In regards to the second bold statement, I'm not going to debateit in relation to the President since that would be getting into a political debate and that's not what this thread is for nor do I wish to go there so let's leave it at that. However at least make sure that you get the quotes correct, in a recent interview this is what was said by the President "I think something’s happening. Something’s changing and it’ll change back again,” he said. “I don’t think it’s a hoax. I think there’s probably a difference. But I don’t know that it’s manmade. I will say this: I don’t want to give trillions and trillions of dollars. I don’t want to lose millions and millions of jobs.” https://www.theguardian.com/us-news...e-change-not-a-hoax-but-denies-lasting-impact
-
Hello, please take a minute to check out our awesome content, contributed by the wonderful members of our community. We hope you'll add your own thoughts and opinions by making a free account!
You are using an out of date browser. It may not display this or other websites correctly.
You should upgrade or use an alternative browser.
You should upgrade or use an alternative browser.
Learning Global Warming facts and fiction
- Thread starter Stormlover
- Start date
- Status
- Not open for further replies.
MichaelJ
Member
I personally know three eminently credentialed and qualified Atmospheric Scientists (my brother is one, he has a Phd in Atmospheric Sciences from MIT) who have been ostracized by Faculty and Administration in academia in a very career threatening way, unless they drop their debate about the legitimacy and degree of AGW. One has already been "urged' to retire and not allowed to spend class time on AGW skeptics or science which supports them. This is not the way science should be, and I truly hope we can get back to the "civil and open debate" about the actual observed facts as they relate to AGW. We see what happens when a process becomes completely politicized like the recent Kavanaugh hearings where truth and facts are trumped (excuse the pun) by a torrent of emotion instead of verified truth. Thanks to everyone here for trying to return to actual debate rather than character assassination and innuendo.
pcbjr
Member
Do we even need to "debate", about weather at least ... how about let's discuss ... like a bunch of friends, or family with some friends in for the partyI personally know three eminently credentialed and qualified Atmospheric Scientists (my brother is one, he has a Phd in Atmospheric Sciences from MIT) who have been ostracized by Faculty and Administration in academia in a very career threatening way, unless they drop their debate about the legitimacy and degree of AGW. One has already been "urged' to retire and not allowed to spend class time on AGW skeptics or science which supports them. This is not the way science should be, and I truly hope we can get back to the "civil and open debate" about the actual observed facts as they relate to AGW. We see what happens when a process becomes completely politicized like the recent Kavanaugh hearings where truth and facts are trumped (excuse the pun) by a torrent of emotion instead of verified truth. Thanks to everyone here for trying to return to actual debate rather than character assassination and innuendo.
snowlover91
Member
Well as far as as skeptics about AGW it all depends on your news source. Of course both right and left leaning sources are going to put out information that supports their point of view. Of course the media will put out whatever info gets them the most “hits” so it’s not going to ever be balanced either way. I never argued any single weather event supported or denied AGWs existence, lots of media puts out skeptical articles when we do we have abnormal cold shots as well. Just saw the article on Trump’s statement, brand new of course, but a change from what I quoted earlier. Of course no one on either side is advocating trillions of dollars or millions of jobs, but I guess I’m glad he’s at least discussing it. Nice discussing this with you, and will in the future, although it seemed you addressed a lot of my points other than my main premise regarding risk/ benefit analysis with the science at hand. Can’t say I have a lot of time to continue this debate with you, but I hope Americans can have more civil discourse in general like this.
I agree, I wish Americans would be more willing to discuss issues they disagree on in a civil way. It certainly will be interesting to see how things go with time and hopefully our technology advances to the point we can find more cost effective, cleaner, and more environmentally friendly fuel sources which would be a win for the consumer and the environment.
BHS1975
Member
It seems like cat 4s and 5s and super typhoons are popping up out of nowhere these days.
Sent from my iPhone using Tapatalk
Sent from my iPhone using Tapatalk
ForsythSnow
Moderator
Always been several cat 4s and 5s out there in the Pacific and it's the last several years we had a peak in the Atlantic. We should see less active seasons up the next several years I believe and therefore less strong major hurricanes Atlantic wise.It seems like cat 4s and 5s and super typhoons are popping up out of nowhere these days.
Sent from my iPhone using Tapatalk
snowlover91
Member
Interesting that sometime soon we should be getting a full release of the entire email chain regarding the infamous "hockey stick" graph. The University of Arizona fought for 7 years to keep this concealed... It will be interesting to see what these emails reveal, if anything. I'm quite curious myself since you don't spend 7 years trying to keep emails hidden from the public unless there is something you don't want them to know. A full breakdown of this is in the link below.
https://wattsupwiththat.com/2018/09...rizona-climate-emails-imminent/?cn-reloaded=1
https://wattsupwiththat.com/2018/09...rizona-climate-emails-imminent/?cn-reloaded=1
snowlover91
Member
It seems like cat 4s and 5s and super typhoons are popping up out of nowhere these days.
Sent from my iPhone using Tapatalk
While it may "seem" that way, recent papers suggest TC frequency and intensity has been stable if not on a downward trend.
First article regarding the WPAC, source here. https://www.sciencedirect.com/science/article/pii/S0377026517301069
Some simple research on Typhoon formation and TC landfall has been done. We plotted the evolution of total Typhoon (with maximum wind speed exceeding 32.7m/s) frequencies in the WNP since 1977 (due to data availability) and TC landfalls on China since 1960 (see Fig. 9, Fig. 10; below). It is interesting to note that the Typhoon frequency decreases significantly from ID2 (1977–1998; Typhoon number is 11) to ID3 (1999–2014; Typhoon number is 10). As for the TC landfalls on China, the average numbers for the three periods are 8.6, 7.8 and 7.6 respectively. The decrease from ID1 to ID2 is statistically significant, passing a 95% confidence level, while the decrease from ID2 to ID3 is not significant.

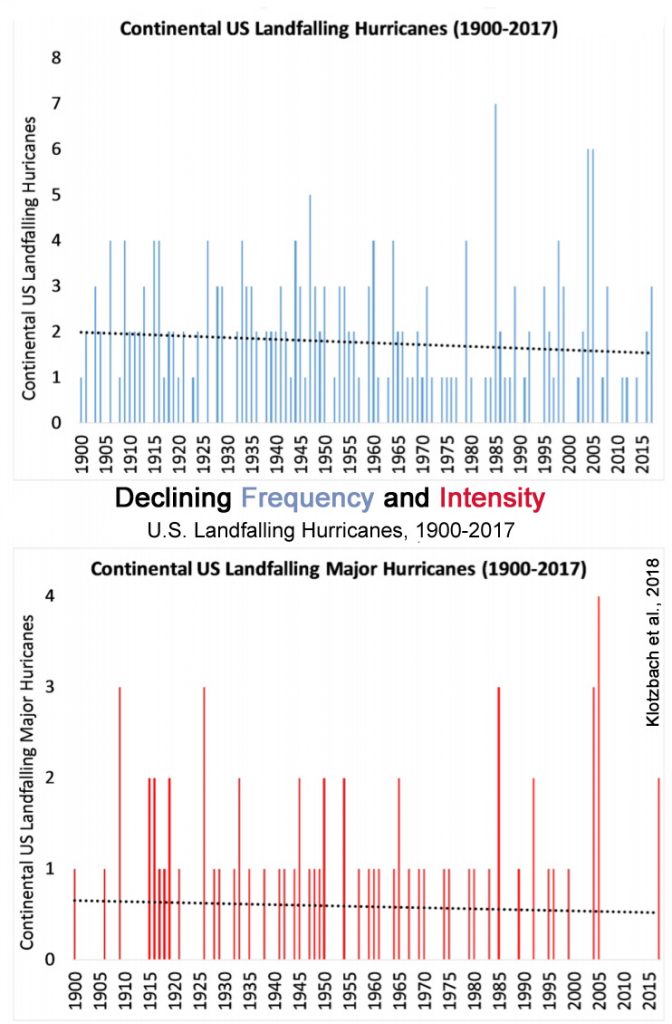
Philip Klotzbach had this to say regarding the US, full discussion here. https://journals.ametsoc.org/doi/10.1175/BAMS-D-17-0184.1
“Since 1900 neither observed CONUS [Continental United States] landfalling hurricane frequency nor intensity show significant trends, including the devastating 2017 season. While neither U.S. landfalling hurricane frequency nor intensity shows a significant trend since 1900, growth in coastal population and wealth have led to increasing hurricane-related damage along the U.S. coastline.”
Then this...
Ten years ago, Webster et al. documented a large and significant increase in both the number as well as the percentage of category 4 and 5 hurricanes for all global basins from 1970 to 2004, and this manuscript examines whether those trends have continued when including 10 additional years of data. In contrast to that study, as shown here, the global frequency of category 4 and 5 hurricanes has shown a small, insignificant downward trend while the percentage of category 4 and 5 hurricanes has shown a small, insignificant upward trend between 1990 and 2014. Accumulated cyclone energy globally has experienced a large and significant downward trend during the same period. The primary reason for the increase in category 4 and 5 hurricanes noted in observational datasets from 1970 to 2004 by Webster et al. is concluded to be due to observational improvements at the various global tropical cyclone warning centers, primarily in the first two decades of that study. https://journals.ametsoc.org/doi/abs/10.1175/JCLI-D-15-0188.1
Another study adds more info..
“Our record of tropical cyclone activity reveals no significant trends in the total number of tropical cyclones (tropical storms and hurricanes) in the best sampled regions for the past 318 years. However, the total number of hurricanes in the 20th century is ∼20% lower than in previous centuries. … Long-term variations in the number of tropical cyclones do not show any evidence of increasing storm frequency and have declined a nonstatistically significant amount.” https://agupubs.onlinelibrary.wiley.com/doi/full/10.1029/2008GC002066
Although it may seem that the numbers of tropical systems and intensity are increasing the data out there indicates otherwise.
SimeonNC
Member
This may be too political and/or off topic but a lot of the people I've seen who are aggressive AGW believers and bash AGW skeptics as science deniers tend to hold beliefs themselves that go against established science.
While it may "seem" that way, recent papers suggest TC frequency and intensity has been stable if not on a downward trend.
Although it may seem that the numbers of tropical systems and intensity are increasing the data out there indicates otherwise.
Social media, with the ease of reporting on storms around the world; has made it seem like they are increasing. 100, 50, even 10 years ago, people didn't care as much as they do today. With more interest being drawn to tropical systems now than ever before, it is easy for things to be over hyped. It's much like the reports on gun violence and terrorists attacks. These things have happened throughout the history of humankind. However, with tools of mass communication now being used, the stories on them are just easier to be shared and told. People only talk about the big ones.
Last edited:
snowlover91
Member
After a VERY slow start to the ice growth the Arctic is finally taking off.

New ice is in the green area. Still a lot of work to do but a solid recovery considering the well AN temps in this region.

New ice is in the green area. Still a lot of work to do but a solid recovery considering the well AN temps in this region.
After a VERY slow start to the ice growth the Arctic is finally taking off.
View attachment 7099
New ice is in the green area. Still a lot of work to do but a solid recovery considering the well AN temps in this region.
View attachment 7100
However, look at how warm the Arctic has been the last 40 days:
http://ocean.dmi.dk/arctic/plots/meanTarchive/meanT_2018.png
BHS1975
Member
One thing for sure we are going to learn a ton about the climate system by screwing it up and then trying to fix it. Very interesting times to be living.
Sent from my iPhone using Tapatalk
Sent from my iPhone using Tapatalk
snowlover91
Member
However, look at how warm the Arctic has been the last 40 days:
http://ocean.dmi.dk/arctic/plots/meanTarchive/meanT_2018.png
Yeah it’s been warm but if you compare it to other recent years it’s pretty similar, no significant changes there.
snowlover91
Member
Sea ice is expanding quite nicely.

Some areas in Canada to Greenland are actually freezing a bit quicker than the long term average, likely due to the colder than normal temps in this area. Still some work to do in other areas but nice ice growth right now.

Some areas in Canada to Greenland are actually freezing a bit quicker than the long term average, likely due to the colder than normal temps in this area. Still some work to do in other areas but nice ice growth right now.
accu35
Member
some how, this makes me happySea ice is expanding quite nicely.
View attachment 7175
Some areas in Canada to Greenland are actually freezing a bit quicker than the long term average, likely due to the colder than normal temps in this area. Still some work to do in other areas but nice ice growth right now.
View attachment 7176
snowlover91
Member
Right now the sea ice extent is increasing much quicker than other recent years. It may slow down soon but it's interesting that 850s are shown as cooling over the Arctic Circle while surface temps much closer to normal instead of the torch that has been in place.
Compare this forecast for roughly 10 days out at the surface

To current anomalies

And 850s cool quite a bit as well. Interesting.

Compare this forecast for roughly 10 days out at the surface
To current anomalies
And 850s cool quite a bit as well. Interesting.
snowlover91
Member
I found an interesting graphic from DMI that shows summer temps have remained quite constant in the Arctic while winter temps have been experiencing gradual increases since 1960. I would presume enhanced blocking is partially responsible for the increased winter temps, any ideas here?
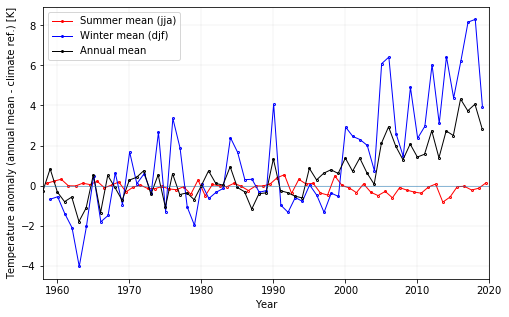
I found an interesting graphic from DMI that shows summer temps have remained quite constant in the Arctic while winter temps have been experiencing gradual increases since 1960. I would presume enhanced blocking is partially responsible for the increased winter temps, any ideas here?
This is consistent with this site and is what I've been saying:
http://ocean.dmi.dk/arctic/meant80n.uk.php
snowlover91
Member
This is consistent with this site and is what I've been saying:
http://ocean.dmi.dk/arctic/meant80n.uk.php
Here's what I'm wondering though, with ice extent decreasing in recent years (especially since 1979 to present) why is it that the summer temps have consistently been averaging at to slightly BN since 1960 but the winter, spring and fall temps increasing? I feel like this was discussed some but I haven't seen any research papers dealing much with this phenomenon and why. If AGW was truly the cause for melting and the warming, should we not expect the warming to be consistent across all seasons and especially the summer as the ice extent decreases over time? I'd be interested in reading some research papers on this if anyone has come across any.
snowlover91
Member
Found this interesting article that's well worth a read. Outlined in it are some of the key "alarmist" claims that are then debunked as misleading or weak arguments. Here's a few excerpts below with the full article here. https://merionwest.com/2017/04/25/r...-on-the-public-discourse-over-climate-change/
On Mann's infamous hockey stick graph:
"Mann used tree rings from bristle cone pines to estimate Northern Hemisphere temperatures back hundreds of years. This was done by calibrating the tree ring data with surface observations for a thirty year period, and using this calibration to estimate temperatures in the distant past in order to eliminate the medieval warm period. Indeed, this reconstruction showed flat temperatures for the past thousand years. The usual test for such a procedure would be to see how the calibration worked for observations after the calibration period. Unfortunately, the results failed to show the warming found in the surface data. The solution was starkly simple and stupid. The tree ring record was cut off at the end of the calibration period and replaced by the actual surface record. In the Climategate emails (Climategate refers to a huge release of emails from various scientists supporting alarm where the suppression of opposing views, the intimidation of editors, the manipulation of data, etc. were all discussed), this was referred to as Mann’s trick."
Extreme weather events:
"Every line weather forecaster knows that extreme events occur someplace virtually every day. The present temptation to attribute these normally occurring events to climate change is patently dishonest. Roger Pielke, Jr. actually wrote a book detailing the fact that there is no trend in virtually any extreme event (including tornados, hurricanes, droughts, floods, etc.) with some actually decreasing. Even the UN’s IPCC acknowledges that there is no basis for attributing such events to anthropogenic climate change."
Sea level rise:
"Globally averaged sea level appears to have been rising at the rate of about 6 inches a century for thousands of years. Until the advent of satellites, sea level was essentially measured with tide gauges which measure the sea level relative to the land level. Unfortunately, the land level is also changing, and as Emery and Aubrey note, tectonics are the major source of change at many locations. Beginning in 1979 we began to use satellites to measure actual sea level. The results were surprisingly close to the previous tide gauge estimates, but slightly higher, but one sees from Wunsch et al (DOI: 10.1175/2007JCLI1840.1) that one is in no position to argue that small differences from changing methodologies represents acceleration. Regardless, the changes are small compared to the claims that suggest disastrous changes. However, even in the early 1980’s advocates of warming alarm like S. Schneider argued that sea level would be an easily appreciated scare tactic. The fact that people like Al Gore and Susan Solomon (former head of the IPCC’s Scientific Assessment) have invested heavily in ocean front property supports the notion that the issue is propagandistic rather than scientific."
Arctic Sea ice:
"Satellites have been observing arctic (and Antarctic) sea ice since 1979. Every year there is a pronounced annual cycle where the almost complete winter coverage is much reduced each summer. During this period there has been a noticeable downtrend is summer ice in the arctic (with the opposite behavior in the Antarctic), though in recent years, the coverage appears to have stabilized. In terms of climate change, 40 years is, of course, a rather short interval. Still, there have been the inevitable attempts to extrapolate short period trends leading to claims that the arctic should have already reached ice free conditions. Extrapolating short term trends is obviously inappropriate. Extrapolating surface temperature changes from dawn to dusk would lead to a boiling climate in days. This would be silly. The extrapolation of arctic summer ice coverage looks like it might be comparably silly. Moreover, although the satellite coverage is immensely better than what was previously available, the data is far from perfect. The satellites can confuse ice topped with melt water with ice free regions. In addition, temperature might not be the main cause of reduced sea ice coverage. Summer ice tends to be fragile, and changing winds play an important role in blowing ice out of the arctic sea. Associating changing summer sea ice coverage with climate change is, itself, dubious. Existing climate models hardly unambiguously predict the observed behavior. Predictions for 2100 range from no change to complete disappearance. Thus, it cannot be said that the sea ice behavior confirms any plausible prediction.
It is sometimes noted that concerns for disappearing arctic sea ice were issued in 1922, suggesting that such behavior is not unique to the present. The data used, at that time, came from the neighborhood of Spitzbergen. A marine biologist and climate campaigner has argued that what was described was a local phenomenon, but, despite the claim, the evidence presented by the author is far from conclusive. Among other things, the author was selective in his choice of ‘evidence.’
All one can say, at this point, is that the behavior of arctic sea ice represents one of the numerous interesting phenomena that the earth presents us with, and for which neither the understanding nor the needed records exist. It probably pays to note that melting sea ice does not contribute to sea level rise. Moreover, man has long dreamt of the opening of this Northwest Passage. It is curious that it is now viewed with alarm. Of course, as Mencken noted, “The whole aim of practical politics is to keep the populace alarmed (and hence clamorous to be led to safety) by an endless series of hobgoblins, most of them imaginary.” The environmental movement has elevated this aim well beyond what Mencken noted."
Coral Reef bleaching:
The alleged death of coral reefs is partly linked to the acidification issue above, and as we see, the linkage is almost opposite to what is claimed. There is also the matter of warming per se leading to coral bleaching. A typical alarmist presentation can be found here.
The article is behind a pay wall, but most universities provide access to Nature. The reasoned response to this paper is provided here. As Steele, the author of the above, points out, bleaching has common causes other than warming and is far from a death sentence for corals whose capacity to recover is substantial. This article is a bit polemical, but essentially correct."
snowlover91
Member
There's not really a specific thread for this but I thought I'd post some updates in here regarding Arctic ice extent and volume. Here's the latest NSIDC chart for ice extent.

Here's the DMI volume.
Here's the DMI volume.
snowlover91
Member
Ice update, based on NSIDC numbers the ice extent is the 3rd highest we’ve seen post 2005. Certainly encouraging to see. https://forum.arctic-sea-ice.net/index.php/topic,2223.2100.html

After Arctic anomalies of a whopping +12C at the start of Nov, they have plunged to only ~+2 to +3C which are the lowest in nearly two months. However, with the oncoming strong -AO, I expect they’ll bounce back up for the next 7-10 days or so:
http://ocean.dmi.dk/arctic/meant80n.uk.php
http://ocean.dmi.dk/arctic/meant80n.uk.php
snowlover91
Member
After Arctic anomalies of a whopping +12C at the start of Nov, they have plunged to only ~+2 to +3C which are the lowest in nearly two months. However, with the oncoming strong -AO, I expect they’ll bounce back up for the next 7-10 days or so:
http://ocean.dmi.dk/arctic/meant80n.uk.php
Larry, any theories as to what is causing the rapid ice buildup this year, or anyone else? SST's across much of the Arctic were well AN to start the season and per the graph you linked the temps were well AN for a time as well although now they are a little closer to normal. Comparing to other recent years I don't see anything noticeable with temps that would explain the rapid increase we are seeing. Any thoughts or ideas?
Latest JAXA and NSIDC extent data show that we now have the 11th lowest sea ice on satellite record or another way to look at it is the 3rd highest post 2005. Here are some charts and graphs from another site that catalogs these in detail. https://forum.arctic-sea-ice.net/index.php/topic,2223.msg181476.html#new
JAXA data


NSIDC data

snowlover91
Member
Also here is today’s NSIDC ice extent. Notice we are ahead of schedule in the Hudson Bay and around Greenland (Davis strait I believe). The biggest key will be ice volume, let’s see over the winter how that does.

snowlover91
Member
Interesting article on what may be causing some of the sea level rise along the East Coast.
Piecuch et al., 2018
https://www.nature.com/articles/s41586-018-0787-6
“Identifying the causes of historical trends in relative sea level—the height of the sea surface relative to Earth’s crust—is a prerequisite for predicting future changes. Rates of change along the eastern coast of the USA (the US East Coast) during the past century were spatially variable, and relative sea level rose faster along the Mid-Atlantic Bight than along the South Atlantic Bight and the Gulf of Maine. Past studies suggest that Earth’s ongoing response to the last deglaciation1,2,3,4,5, surface redistribution of ice and water5,6,7,8,9 and changes in ocean circulation9,10,11,12,13 contributed considerably to this large-scale spatial pattern. Here we analyse instrumental data and proxy reconstructions using probabilistic methods to show that vertical motions of Earth’s crust exerted the dominant control on regional spatial differences in relative sea-level trends along the US East Coast during 1900–2017, explaining most of the large-scale spatial variance. Rates of coastal subsidence caused by ongoing relaxation of the peripheral forebulge associated with the last deglaciation are strongest near North Carolina, Maryland and Virginia. Such structure indicates that Earth’s elastic lithosphere is thicker than has been assumed in other models. We also find a substantial coastal gradient in relative sea-level trends over this period that is unrelated to deglaciation and suggests contributions from twentieth-century redistribution of ice and water. Our results indicate that the majority of large-scale spatial variation in long-term rates of relative sea-level rise on the US East Coast is due to geological processes that will persist at similar rates for centuries.”
Of interest is the current sea ice coverage. While we are around the 4th lowest, the NSIDC data indicates the only significant area that is BN is the area NE of Greenland and that area is rapidly filling in with ice now due to colder temperatures. It will be interesting to see how things unfold especially with the SSW ongoing.
BHS1975
Member
The latest reports that came out are looking pretty dire. We are going to have to have some drastic changes soon to avoid catastrophe.
Sent from my iPhone using Tapatalk
Sent from my iPhone using Tapatalk
RVD
Meteorology Student
Interesting article on what may be causing some of the sea level rise along the East Coast.
Piecuch et al., 2018
https://www.nature.com/articles/s41586-018-0787-6
“Identifying the causes of historical trends in relative sea level—the height of the sea surface relative to Earth’s crust—is a prerequisite for predicting future changes. Rates of change along the eastern coast of the USA (the US East Coast) during the past century were spatially variable, and relative sea level rose faster along the Mid-Atlantic Bight than along the South Atlantic Bight and the Gulf of Maine. Past studies suggest that Earth’s ongoing response to the last deglaciation1,2,3,4,5, surface redistribution of ice and water5,6,7,8,9 and changes in ocean circulation9,10,11,12,13 contributed considerably to this large-scale spatial pattern. Here we analyse instrumental data and proxy reconstructions using probabilistic methods to show that vertical motions of Earth’s crust exerted the dominant control on regional spatial differences in relative sea-level trends along the US East Coast during 1900–2017, explaining most of the large-scale spatial variance. Rates of coastal subsidence caused by ongoing relaxation of the peripheral forebulge associated with the last deglaciation are strongest near North Carolina, Maryland and Virginia. Such structure indicates that Earth’s elastic lithosphere is thicker than has been assumed in other models. We also find a substantial coastal gradient in relative sea-level trends over this period that is unrelated to deglaciation and suggests contributions from twentieth-century redistribution of ice and water. Our results indicate that the majority of large-scale spatial variation in long-term rates of relative sea-level rise on the US East Coast is due to geological processes that will persist at similar rates for centuries.”
Just wanted to comment some on this article, because I don't think the way you interpreted it is what the authors were getting at....
The article is talking about causes of regional differences ("spatial variation" is the phrase they latch onto) in sea level rise, and not what's causing sea level rise overall. In fact, they note that the "inexorable geological processes [the article is concerned with] will exacerbate predicted sea-level rise related to ocean thermal expansion, melting land ice and ocean circulation changes," not that they are a sufficient replacement for those processes.
If this distinction isn't clear, think of it like a bathtub slowly filling with water. The article doesn't necessarily care about what's causing the tub to fill, but rather what causes differences in measurements of overflowing water made at two locations (at the same height) along the edge of the tub. Maybe over a short time period JB's been sloshing it up and some big differences are observed. But even over longer time periods that average out these sloshes, the two locations might be still recording slightly different overflowing rates. This article shows that these differences are mainly due to the fact that the bottom of the tub is warped and is in the process of warping, but that warping itself cannot cause the sorts of global rises in bathtub water level that are observed.
I don't think you intended to mislead or anything like that, I just wanted to clear things up a bit for anybody reading because when I first saw your post it seemed like you and the article were saying different things.
snowlover91
Member
Just wanted to comment some on this article, because I don't think the way you interpreted it is what the authors were getting at....
The article is talking about causes of regional differences ("spatial variation" is the phrase they latch onto) in sea level rise, and not what's causing sea level rise overall. In fact, they note that the "inexorable geological processes [the article is concerned with] will exacerbate predicted sea-level rise related to ocean thermal expansion, melting land ice and ocean circulation changes," not that they are a sufficient replacement for those processes.
If this distinction isn't clear, think of it like a bathtub slowly filling with water. The article doesn't necessarily care about what's causing the tub to fill, but rather what causes differences in measurements of overflowing water made at two locations (at the same height) along the edge of the tub. Maybe over a short time period JB's been sloshing it up and some big differences are observed. But even over longer time periods that average out these sloshes, the two locations might be still recording slightly different overflowing rates. This article shows that these differences are mainly due to the fact that the bottom of the tub is warped and is in the process of warping, but that warping itself cannot cause the sorts of global rises in bathtub water level that are observed.
I don't think you intended to mislead or anything like that, I just wanted to clear things up a bit for anybody reading because when I first saw your post it seemed like you and the article were saying different things.
Correct, the article is talking about the regional differences along the East Coast and why some locations are rising slower/faster than others. There was some earlier discussion in this thread about some areas in the Mid-Atlantic that flood more frequently than they used to 30-40 years ago. This article is interesting as it provides some new research into why some areas might be rising quicker than others.
I originally stated "Interesting article on what may be causing some of the sea level rise along the East Coast." I'm not sure how this could be misinterpreted to refer to global sea level rise or anything else; it was simply a statement that this could be one factor explaining the faster sea level rise in some areas along the East Coast.
The issue of regional sea level rise (and even global) is a bit more complex. Satellite estimates are not the best method for sea level rise and there is a far higher density of reliable tide gauges available now than there was in the past. These new tide gauges with relatively short historical observations (25 years or less), tectonic movements, and other factors are important and worth looking into when examining sea level rise on a regional or global level. Here's one article discussing the difficulty in making regional sea level rise predictions, focusing specifically on the US from what I can tell.
Parker and Ollier, 2017
https://link.springer.com/article/10.1007/s41748-017-0019-5
Background
"Long records of sea level show decadal and multi-decadal oscillations of synchronous and asynchronous phases, which cannot be detected in short-term records. Without incorporating these oscillations, it is impossible to make useful assessments of present global accelerations and reliable predictions of future changes of sea level. Furthermore, it is well known that local sea-level changes occur also because of local factors such as subsidence due to groundwater or oil extraction, or tectonic movements that may be either up or down.
Methods
Linear and parabolic fittings of monthly average mean sea levels (MSL) of global as well as different local (United States Atlantic Coast, United States Pacific Coast) data sets of long tide gauge records."
“[L]ocal sea-level forecasts should be based on proven local sea-level data. Their naïve averaging of all the tide gauges included in the PSMSL surveys showed ‘relative’ trends of about + 1.04 mm/year (570 tide gauges of any length). By only considering the 100 tide gauges with more than 80 years of recording, the average trend was only + 0.25 mm/year [2.5 centimeters per century].”
“The loud divergence between sea-level reality and climate change theory—the climate models predict an accelerated sea-level rise driven by the anthropogenic CO2 emission—has been also evidenced in other works such as Boretti (2012a, b), Boretti and Watson (2012), Douglas (1992), Douglas and Peltier (2002), Fasullo et al. (2016), Jevrejeva et al. (2006), Holgate (2007), Houston and Dean (2011), Mörner 2010a, b, 2016), Mörner and Parker (2013), Scafetta (2014), Wenzel and Schröter (2010) and Wunsch et al. (2007) reporting on the recent lack of any detectable acceleration in the rate of sea-level rise. The minimum length requirement of 50–60 years to produce a realistic sea-level rate of rise is also discussed in other works such as Baart et al. (2012), Douglas (1995, 1997), Gervais (2016), Jevrejeva et al. (2008), Knudsen et al. (2011), Scafetta (2013a, b), Wenzel and Schröter (2014) and Woodworth (2011). … [T]he information from the tide gauges of the USA and the rest of the world when considered globally and over time windows of not less than 80 years […] does not support the notion of rapidly changing mass of ice in Greenland and Antarctica as claimed by Davis and Vinogradova (2017). The sea levels have been oscillating about a nearly perfectly linear trend since the start of the twentieth century with no sign of acceleration. There are only different phases of some oscillations moving from one location to another that do not represent any global acceleration. … The global sea-level acceleration is therefore in the order of + 0.002 ± 0.003 mm/year², i.e. + 2 ÷ 3 μm/year², well below the accuracy of the estimation. This means that the sea levels may rise in the twenty-first century only a few centimeters more than what they rose during the twentieth century. This is by no means alarming.”
Morner provides the analysis on the below graph by Mann and others and adds some interesting commentary. Their paper is here.

The latest reports that came out are looking pretty dire. We are going to have to have some drastic changes soon to avoid catastrophe.
Sent from my iPhone using Tapatalk
Hello,
Can you please provide the reports for review. Also, what specifically are we going to have to change?
Thank You,
Eric
BHS1975
Member
Hello,
Can you please provide the reports for review. Also, what specifically are we going to have to change?
Thank You,
Eric
https://nca2018.globalchange.gov
http://science.sciencemag.org/content/363/6423/128/tab-pdf
Sent from my iPhone using Tapatalk
snowlover91
Member
https://nca2018.globalchange.gov
http://science.sciencemag.org/content/363/6423/128/tab-pdf
Sent from my iPhone using Tapatalk
The NCA4 is decidedly biased and has quite a few issues with it, I hope you don't take it at face value? Have you read the public comments and articles on it that question the data or extreme alarmist view they take? Here's a link if you're interested in reading the public comments; I find the NCA4 responses quite disappointing when it comes to people who disagree with them. https://nca2018.globalchange.gov/downloads/NCA4_Public_Comments_Author_Responses_with_Names.pdf
Understand this also, the report is based off some extreme scenarios occurring and computer modeling. You know as well as I do computer models struggle to predict even simple pattern changes 10+ days out or a snow storm 4-5 days away at times. Can we really trust them to accurately pick up the effects of CO2, natural variations and feedbacks (known and unknown) over the next 100 years?
Dr Steve Koonin (an Obama appointee btw) wrote this summary here.
"The report’s numbers, uncertain as they are, turn out not to be all that alarming. The final figure of the final chapter [Chapter 29, page 170] shows that an increase in global average temperatures of 9 degrees Fahrenheit (beyond the 1.4-degree rise already recorded since 1880) [RCP8.5, an implausible scenario, “that does not provide a useful benchmark for policy studies.”] would directly reduce the U.S. gross domestic product in 2090 by 4%, plus or minus 2%—that is, the GDP would be about 4% less than it would have been absent human influences on the climate. That “worst-worst case” estimate assumes the largest plausible temperature rise and only known modes of adaptation. To place a 4% reduction in context, conservatively assume that real annual GDP growth will average 2% in the coming decades (it has averaged 3.2% since 1935 and is currently 3%). That would result in a U.S. economy roughly four times as large in 2090 as today. A 4% climate impact would reduce that multiple to 3.8—a correction much smaller than the uncertainty of any projection over seven decades. … The U.S. economy in 2090 would be no more than two years behind where it would have been absent man-caused climate change. Experts know that worst-case climate projections show minimal impact on the overall economy. Buried in the Intergovernmental Panel on Climate Change’s 2014 report is a chart showing that a global temperature rise of 5 degrees Fahrenheit would have a global economic impact of about 3% in 2100—negligibly diminishing projected global growth over that period to 385% from 400%. If we take the new report’s estimates at face value, human-induced climate change isn’t an existential threat to the overall U.S. economy through the end of this century—or even a significant one. … There are many reasons to be concerned about a changing climate, including disparate impact across industries and regions. But national economic catastrophe isn’t one of them. It should concern anyone who supports well-informed public and policy discussions that the report’s authors, reviewers and media coverage obscured such an important point."
They failed to be objective and ignored the hurricane data because it didn't fit their agenda. See below.
University of Colorado Boulder Professor Roger Pielke, Jr. Ph.D. called the report “embarrassing,” in a series of tweets writing:
How is it that the 2018 US National Climate Assessment failed to include or overlooked trends in US landfalling hurricanes which would … seem pretty important in a US climate report[?]
[the report ignored one of its own expert reviewers who wrote this]: ‘National Hurricane Center going back to the 1800s data clearly indicate a drop in the decadal rate of US landfalling hurricanes since the 1960s… instead you spin the topic to make it sound like the trends are all towards more cyclones.’
Let’s observe here hurricanes are discussed at length in the report, and every hurricane that is discussed is … a landfalling storm. The failure to include trend data on US landfalling hurricanes in USNCA is a remarkable choice. What, were they thinking no one would notice?
Here’s the source of the top line conclusion of the U.S. National Climate Assessment, 10 [percent] damage to U.S GDP. It’s derived from a study funded by Tom Steyer [billionaire democratic donor and climate activist], et al. … The 15 degree Fahrenheit temp increase is double the most extreme value reported elsewhere in the report [The ‘sole editor’ of this claim was an alumni of the Center for American Progress, which is also funded by Tom Steyer].
The climate change agenda is more about money and power control than it is "saving the planet" as the proponents want you to believe. How about wind farms which waste large tracts of land and kill thousands of birds? What about all the waste that is produced in making them, the danger of fire, the lack of consistent energy supply and other problems caused by wind energy? Solar energy isn't much better, especially in the winter when some areas have only a few hours of daylight and long nights. How are we going to power hospitals and the heating/cooling demands of houses and businesses if we rely on these supposedly "clean" energy methods? What happens when the wind isn't blowing and the sun just can't meet the demand? What if you have a hail storm that destroys the entire solar grid powering thousands of homes and businesses? Where will all the land come from to replace fossil fuels with these "clean" energy ideas?
I would highly recommend you research the agenda that is being pushed by these climate alarmists and the news media. See below.
"The late Stephen Schneider, who authored The Genesis Strategy, a 1976 book warning that global cooling risks posed a threat to humanity, later changed that view 180 degrees, serving as a lead author for important parts of three sequential IPCC reports. In a quotation published in Discover, he said: “On the one hand, as scientists we are ethically bound to the scientific method, on the other hand, we are not just scientists, but human beings as well. And like most people, we’d like to see the world a better place, which in this context translates into our working to reduce the risk of potentially disastrous climatic change. To do that, we need to get some broad-based support, to capture the public’s imagination. That, of course, entails getting loads of media coverage. So we have to offer up scary scenarios, make simplified, dramatic statements, and make little mention of the doubts we might have. Each of us has to decide what the right balance is between being effective and being honest.”
"IPCC official Ottmar Edenhofer, speaking in November 2010, advised that: “…one has to free oneself from the illusion that international climate policy is environmental policy. Instead, climate change policy is about how we redistribute de facto the world’s wealth...”
Wigley and Trenberth suggested in another e-mail to Mann: “If you think that [Yale professor James] Saiers is in the greenhouse skeptics camp, then, if we can find documentary evidence of this, we could go through official [American Geophysical Union] channels to get him ousted [as editor-in-chief of the Geophysical Research Letters journal].”
A July 2004 communication from Phil Jones to Michael Mann referred to two papers recently published in Climate Research with a “HIGHLY CONFIDENTIAL” subject line observed: “I can’t see either of these papers being in the next IPCC report. Kevin [Trenberth] and I will keep them out somehow---even if we have to redefine what the peer review literature is." Source for these is here.
If what they are advocating is true (climate alarmism, AGW) then why are they so afraid of transparency and dissenting views to the point they would redefine peer reviewed literature or seek to silence someone they disagree with? Does this not worry you?
Last edited:
D
Deleted member 527
Guest
I used to be a skeptic of climate change. I believe in it fully now. Next year will be another indice blamed for lack of snow. This climate is changing. Why I don’t know.
pcbjr
Member
Go back and study the 1930's ...I used to be a skeptic of climate change. I believe in it fully now. Next year will be another indice blamed for lack of snow. This climate is changing. Why I don’t know.
cd2play
Member
Yeah, I took a peak a while back at climate archive, and there were some real clunkers in there. But, if those were to happen again verbatim, JB would still find a way to predict a cold and snowy winter. With JB, there is ALWAYS hope Bastardi FTW!Go back and study the 1930's ...
cd2play
Member
Weather it's climate change, or a cycle that's simply going to outlast our lifetimes, or whatever it is, the fact is there is nothing we can do about it. It's going to do what it's going to do. FWIW, I tend to believe it has a lot to do with the AMO. Our decline in snowfall seems to have started right about the time the flip to warm AMO happened.
MichaelJ
Member
Instead of arguing over what causes the "alleged Global Warming" we are currently experiencing for the past 30 years, we need to start building spaceships for the worlds population. Since one of the leading lights of the Democrat party says we only have 12 years until we cease to exist we better get Elon Musk on it pronto!!! Only question I have is where would we fly these spaceships to exactly? Gee, I hope they have cable TV and Internet there!!
snowlover91
Member
Instead of arguing over what causes the "alleged Global Warming" we are currently experiencing for the past 30 years, we need to start building spaceships for the worlds population. Since one of the leading lights of the Democrat party says we only have 12 years until we cease to exist we better get Elon Musk on it pronto!!! Only question I have is where would we fly these spaceships to exactly? Gee, I hope they have cable TV and Internet there!!
Interesting question raised. If we did indeed try to live on other planets it would be quite interesting to see how the logistics would be worked out. For example water, necessary for human and plant life, where do you get enough sustainably, practically and easy enough to sustain humans and plant life (if we try to grow crops on said planet)... and heat/cooling of a building to protect humans from the extremes, how do you power that? Living on another planet would present immense challenges to provide the basic requirements for human life; shelter, food, water, heating/cooling of building.
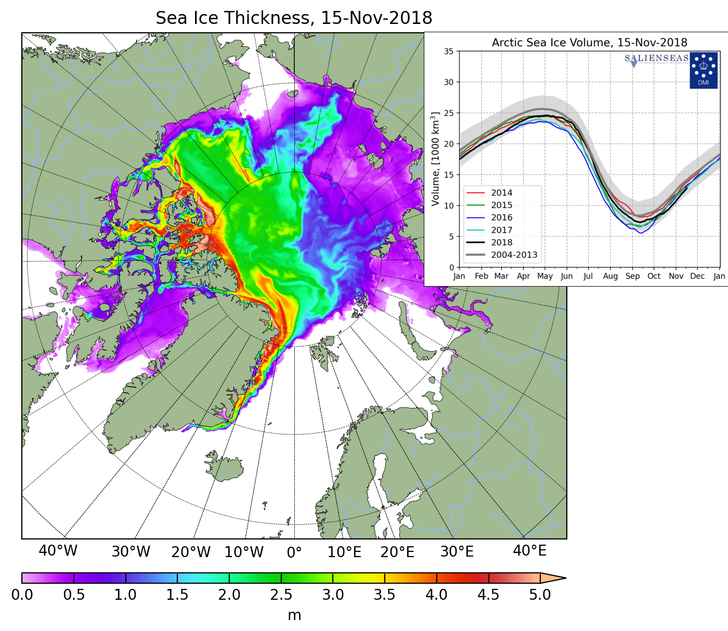
Meanwhile the Arctic ice volume is close to the 2004-13 average and above recent years except 2014.

It's also interesting to note this is the first year in quite awhile that temperatures are hovering fairly close to normal in the 80N region.

Last year and other recent years it was quite different.

- Status
- Not open for further replies.