NBAcentel
Member
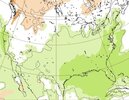
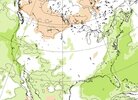
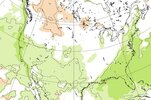
Classic cold rain pattern 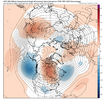


That’s the “gross” looking El Niño patternClassic cold rain pattern View attachment 199232

Better to get this pattern in November rather than December and January.Classic cold rain pattern View attachment 199232
We must transition from hot rain to cold rain before we can get snow.Classic cold rain pattern View attachment 199232
Wouldn’t call it that cold really . Cool rainy perhapsClassic cold rain pattern View attachment 199232

What's even better is heavy snow that melts slowly into the ground just after the solstice, before repeating. Just sayingCold/cool rain and rain in general in any strong Nino is typically frequent, which is great news for drought relief.

Maybe where you’re at. Here CAD country that screams 38-42 degree cold rainWouldn’t call it that cold really . Cool rainy perhaps
You can keep that lolMaybe where you’re at. Here CAD country that screams 38-42 degree cold rain

Good to see the SSW doing work!Classic cold rain pattern View attachment 199232


That’s the “gross” looking El Niño pattern

I have a strong feeling that all the griping about the beautiful period we've had will end in endless misery when we get 50's and rain every two days and the timing always falls on the weekend.


Yeah it's been practically perfect for over a month now. I'll never understand the infatuation with seeing it rain, but maybe I should have a softer heart for farmers, mother nature, and those on well water. Buy hey, I get infatuated with SSWs that many hate, so we're all differentI have a strong feeling that all the griping about the beautiful period we've had will end in endless misery when we get 50's and rain every two days and the timing always falls on the weekend.
Super Ninos definitely aren't built for cold. We'll just be hoping to see periods of active California to Texas wave train > Gulf Lows, and try to get lucky timing wise with enough cold air to our north (I'm moreso interested in Jan-Feb)Kind of happening here already. We've had some rain tonight
Oh and I also heard from the Texas group we had an SSW last year around now and all it did was make it the hottest Christmas ever... So yeah... Now I'm like not this again
The epo is also the complete opposite of how we get cold air here
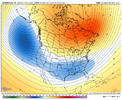
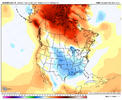
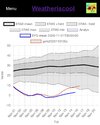
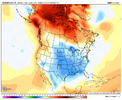 Grain of salt taken, but the Canadian seasonal has trended even colder for every month of the December-March period. February is bonkers cold for a seasonal model.

We need rainWe must transition from hot rain to cold rain before we can get snow.
But it must be very cold rain possibly mixed with sleet.We need rain
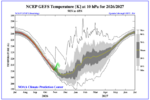
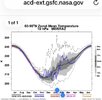

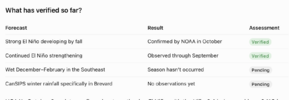
Part forecast is already wrong . Super El Niño not strong still gaining strengthHolding out hope that this verifies. View attachment 199269
Yeah it's been practically perfect for over a month now. I'll never understand the infatuation with seeing it rain, but maybe I should have a softer heart for farmers, mother nature, and those on well water. Buy hey, I get infatuated with SSWs that many hate, so we're all different
Super Ninos definitely aren't built for cold. We'll just be hoping to see periods of active California to Texas wave train > Gulf Lows, and try to get lucky timing wise with enough cold air to our north (I'm moreso interested in Jan-Feb)
View what lol.Guys good news! Models now come in and hour earlier for our viewing pleasure. Happy time change!


 www.facebook.com
Weather Nerds Of Alabama
You may have been hearing about the polar vortex collapse or SSW(sudden stratospheric warming) that models are showing that is about to happen. for the earliest on record. This spreads out the arctic...

@GaWx, maybe they are comparing the temps to the only 3 other November SSW's on record (from your data.) 1968, 1976, and 2009?Thanks for posting this.
So, this Weather Nerds Of Alabama post is comparing winter temps for those that were preceded by an early Nov SSW to those that weren’t. My problem with this comparison is that 2026 is the first early Nov on record with an early Nov SSW! So, every Nov on record before 2026 is in the no early Nov SSW. That’s why it is so historic. Thus, they can’t compare those with to those without since there are none with.

What is this AI slop?Weather Nerds Of Alabama
You may have been hearing about the polar vortex collapse or SSW(sudden stratospheric warming) that models are showing that is about to happen. for the earliest on record. This spreads out the arctic...
@GaWx, maybe they are comparing the temps to the only 3 other November SSW's on record (from your data.) 1968, 1976, and 2009?
I'm not sure what "early" means in their criteria, two were on November 15th and the other November 27th. Am I correct in interpreting from the chart you posted that those are the only 3 years prior to this one to document a true November SSW? We are definitely some rare air (no pun intended.)
I don't know what this bodes for the forthcoming winter, but I would rather have a PV shakeup than not! Especially if winds reverse and stay that way for an extended period. The more unusual things in the atmosphere this winter, the better IMO.
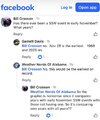
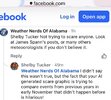
Thanks. Of course, I try to extrapolate for snow events in my area with the four JF years following the SSW's. They all look above average, 1970 is the lowest of the bunch. Grasping at straws, but it's fun to look at data and try to correlate different winter outcomes. I don't think it will be boring this year for any of us.1. I was listing only Novs with SSWs during El Niño. I listed 1968 (the only one with a major SSW), 1976, and 2009. However, upon another check just now, I’m adding 1979 to the list. I’ll post this updated analysis soon in a separate post.
2. I just rechecked the Wx Nerds of AL post to read the comments below it to see if anyone else pointed out the same thing I did. I see that two folks (Bill Crosson and Shelby Tucker) later pointed the same thing out that I did (within the last hour or so)(I’m not either of them and don’t know them)(it got a bit rough in there lol):
View attachment 199277
View attachment 199278
Thanks. Of course, I try to extrapolate for snow events in my area with the four JF years following the SSW's. They all look above average, 1970 is the lowest of the bunch. Grasping at straws, but it's fun to look at data and try to correlate different winter outcomes. I don't think it will be boring this year for any of us.
I meant 1969, thanks for catching that. The JF following '68 was the lowest of the bunch, 0.6", followed by 1977.You said “1970”. Did you mean 1977?
I meant 1969, thanks for catching that. The JF following '68 was the lowest of the bunch, 0.6", followed by 1977.
Larry, even in cold winters, we only get about average of our normal snow except those rare occasions. Typically a niño is back loaded anyways. Its just interesting with strongest niño, +qbo and -pdo, which there just aren't alot of analogs for thatThanks. Here’s the updated post I promised, which adds Nov of 1979 to the Nino Nov SSW list to give us 4 instead of 3 cases:
1. There may be an increased chance at an overall significant DJF averaged -AO after a Nov SSW during El Niño. I found only 4 Nino Novs with a SSW (>15 dip of 10 hPa/60N winds to <10):
1968: dropped ~37 to ~-8 on ~Nov 27th; DJF AO -2.3 (3rd lowest of all winters since 1950)
1976: dropped ~26 to ~+4 on ~Nov 15th; DJF AO -2.6 (2nd lowest of all winters since 1950)
1979: dropped ~24 to ~+6 on ~Nov 23rd; DJF AO -0.6 (31st lowest of all winters since 1950)
2009: dropped ~17 to ~+6 on ~Nov 15th; DJF AO -3.4 (lowest of all winters since 1950)
So, avg DJF AO for these 4 winters was way down at -2.2
——————
2. At least one major SSW followed during each of these 4 winters.
3. CHS had 1.3”+ of SN in each of the 4 subsequent winters! Keep in mind that their longterm avg is only 0.5”:
1968-9: 2.0” and cold winter
1976-7: 1.3” and historic cold
1979-80: 1.3” and cold winter
2009-10: 3.4” and cold winter
). All it is doing is oscillating within the solidly positive region (the image below shows this well).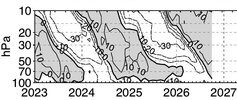
Imo, we just dont have any analogs for this winter that close. Typically most niños are backloaded i thinkThe 30 hPa QBO per ATMO Hub dropped from +17.6 in Sept to +14.0 in Oct. But I advise folks to not take that small drop and interpret that to mean that a -QBO is going to arrive by Feb (though I expect some x weenies to do just that….be prepared
Related to that, 20 hPa and 15 hPa are still maintaining their strong status with +17.5 to +17.6. Also, the level that Paul Roundy referred to a few days ago, 70 hPa, as expected rose sharply from +2.6 to +7.0.
The last 29 +cycles at 30 hPa have lasted 10 months++ and have averaged ~13 months going back to 1960. The current one started in May. Feb ‘27 would be the 10th month and May ‘27 the 13th month.
Thus, I maintain my prediction that there will be a +QBO at 30 hPa through at least Feb with Feb likely lower than the current +14 but likely still at +5+ and possibly as high as ~+10. My best guess as to when it goes to a -QBO is still around May. Thus, 2015-6, 1982-3, and 1957-8 remain the top +QBO/strong+ Nino analogs ignoring where it will be based (east). If the E basedness is then incorporated, 1982-3 easily becomes the best overall analog.
This image (just updated for Oct) better illustrates the current QBO status at all levels. As one can clearly see, we’re in the heart of a solid +QBO at 30 hPa that won’t end per history til at the very least 3 months after we see it first dropping to <0 at 10 hPa. The avg lag of going to -QBO from the 10 hPa level to the 30 hPa level is actually 7 months:
View attachment 199285