Man, yall are some typing Martha Fockers. Good discussion.
-
Hello, please take a minute to check out our awesome content, contributed by the wonderful members of our community. We hope you'll add your own thoughts and opinions by making a free account!
You are using an out of date browser. It may not display this or other websites correctly.
You should upgrade or use an alternative browser.
You should upgrade or use an alternative browser.
Learning Global Warming facts and fiction
- Thread starter Stormlover
- Start date
- Status
- Not open for further replies.
“Japan’s deadly heatwave would have been impossible without climate change”
https://qz.com/1631466/climate-chan...e-scientists-prove/?utm_source=YPL&yptr=yahoo
“The relatively new method, lead author Yukkiko Imada told Climate Home News, sought to pin down the causality of climate change in the heatwave by simulating 18 climate scenarios with and without the current 1C global warming above pre-industrial levels.”
————————————————————————
The above heatwave was from July of 2018. They hit a whopping 106 F in a country surrounded closely by water!
Mind you, this is all happening despite the sun’s radiation being relatively weak over the prior 12 years or so due to the current and prior low sunspot cycles. I had previously been repeatedly posting in various forums back to about the early 2010s that I was open-minded and wanted to see if the global temp were to drop back some by the late 2010s due to these two weak solar cycles, thus allowing for lag, due largely to indirect effects such as increased cosmic rays reaching Earth thus causing increased cooling cloudiness. I was even labeled a “denier” over at you no where just for being open-minded. (I still hate that term as it is too simplistic and mean-spirited. What’s wrong with open-mindedness? I’m so glad I stopped posting there a few years ago.)
But here we are in 2019 amidst a second weak solar minimum with still no sign of global cooling and instead record heat in various places on the globe. I had been hoping that the bulk of 1950+ warming was caused by the most active 50 year period of sunspots in hundreds and possibly thousands of years. For me to be convinced of that, I had to see cooling by about now from the weak sun that started around 2007. Instead of cooling, I’m seeing the opposite. Therefore, I’m just about ready to give up on the late 20th century sun possibly being a prime driver of GW. Like Clara asked in the old Wendy’s commercials, “Where’s the beef?”
*Edited
Last edited:
BHS1975
Member
This is one way to get folks to go green lol.
https://www.sacbee.com/news/state/california/fires/article231338763.html
Sent from my iPhone using Tapatalk
https://www.sacbee.com/news/state/california/fires/article231338763.html
Sent from my iPhone using Tapatalk
Big news out of Toyota today the new EV models are coming out years in advanced. Demand is growing.
BHS1975
Member
Sent from my iPhone using Tapatalk
pcbjr
Member
Things change, and change again, and will do so once more someday ...


... but not to worry ... we won't be around to witness it ...
... but not to worry ... we won't be around to witness it ...
Last edited:
- Joined
- Jan 5, 2017
- Messages
- 3,807
- Reaction score
- 6,063
Big news out of Toyota today the new EV models are coming out years in advanced. Demand is growing.
EV's are bad for biosphere toxicity. Growing contamination of earth, water and air is much more serious than global warming. I expect the debate to take center stage over global warming as it's too late and impractical to reverse the warming. Time to start adapting to the new reality. We can't adapt to toxicity, though. That's why it's more serious.
The giant floating solar farms in the ocean look sick
Rosie
Member
Better than a giant oil slick.The giant floating solar farms in the ocean look sick
pcbjr
Member
Socratic at the very least ...EV's are bad for biosphere toxicity. Growing contamination of earth, water and air is much more serious than global warming. I expect the debate to take center stage over global warming as it's too late and impractical to reverse the warming. Time to start adapting to the new reality. We can't adapt to toxicity, though. That's why it's more serious.
")
BHS1975
Member
Things change, and change again, and will do so once more someday ...
View attachment 20428View attachment 20429View attachment 20430View attachment 20431
... but not to worry ... we won't be around to witness it ...
Did you watch the video? The models are lagging behind observed sea level rise. In other words it could be much higher than expected and rise much quicker.

Sent from my iPhone using Tapatalk
pcbjr
Member
"could" ...Did you watch the video? The models are lagging behind observed sea level rise. In other words it could be much higher than expected and rise much quicker.

Sent from my iPhone using Tapatalk
BHS1975
Member
Sent from my iPhone using Tapatalk
BHS1975
Member
"could" ...
Actually it would be safe to say “will be higher than the models” just don’t know how much.
Sent from my iPhone using Tapatalk
snowlover91
Member
Did you watch the video? The models are lagging behind observed sea level rise. In other words it could be much higher than expected and rise much quicker.
Sent from my iPhone using Tapatalk
Meanwhile...
“Over the past decades, atoll islands exhibited no widespread sign of physical destabilization in the face of sea-level rise. 88.6% of islands were either stable or increased in area, while only 11.4% contracted. It is noteworthy that no island larger than 10 ha decreased in size. These results show that atoll and island areal stability is a global trend, whatever the rate of sea-level rise.”- Duvat, 2019 https://onlinelibrary.wiley.com/doi/full/10.1002/wcc.557
snowlover91
Member
Interesting tweet thread from Ryan Maue about the House hearing on climate change.
Fountainguy97
Member
Just gonna throw this in here.
https://realclimatescience.com/2019/06/tampering-past-the-tipping-point/
There is tons of evidence of data tampering and sneaky use of averages and starting years to make warming look vastly worse than it may be. This article shows the complete erasing of the Medieval Warm period in recent studies and also just plain data tampering by NASA and the likes. Is this true? We cant really say for sure but it sure looks like it haha.
Hard to believe something when you cant trust the "official" sources of info.

Not to mention "climate change" is and has been a political topic for years and even more so now. We all know politics is not known for upstanding and correct data lol. Its now the climate agenda rather than trying to understand what is happening to our planet. Its a democrat vs republican argument with both sides desperate to discredit the other. Of course they will find any data they can and not question its accuracy. If it supports them and tears their opponents down they are using it.
https://realclimatescience.com/2019/06/tampering-past-the-tipping-point/
There is tons of evidence of data tampering and sneaky use of averages and starting years to make warming look vastly worse than it may be. This article shows the complete erasing of the Medieval Warm period in recent studies and also just plain data tampering by NASA and the likes. Is this true? We cant really say for sure but it sure looks like it haha.
Hard to believe something when you cant trust the "official" sources of info.
Not to mention "climate change" is and has been a political topic for years and even more so now. We all know politics is not known for upstanding and correct data lol. Its now the climate agenda rather than trying to understand what is happening to our planet. Its a democrat vs republican argument with both sides desperate to discredit the other. Of course they will find any data they can and not question its accuracy. If it supports them and tears their opponents down they are using it.
Last edited:
Tampering Past The Tipping Point. https://tiny.iavian.net/tmds
Funny, I just posted same article after reading it onlineJust gonna throw this in here.
https://realclimatescience.com/2019/06/tampering-past-the-tipping-point/
There is tons of evidence of data tampering and sneaky use of averages and starting years to make warming look vastly worse than it may be. This article shows the complete erasing of the Medieval Warm period in recent studies and also just plain data tampering by NASA and the likes. Is this true? We cant really say for sure but it sure looks like it haha.
Hard to believe something when you cant trust the "official" sources of info.
View attachment 20648
Not to mention "climate change" is and has been a political topic for years and even more so now. We all know politics is not known for upstanding and correct data lol. Its now the climate agenda rather than trying to understand what is happening to our planet. Its a democrat vs republican argument with both sides desperate to discredit the other. Of course they will find any data they can and not question its accuracy. If it supports them and tears their opponents down they are using it.
snowlover91
Member
Interesting article worth reading. California has a “cap and trade” program that basically taxes companies for their right to emit greenhouse gases. The money was supposed to be used for climate change related efforts but is already being diverted to things that aren’t related and by 2021 all restrictions will be removed on how this money is used.
Again, it’s all about the money. If you don’t believe me read the articles where climate change activists talk about how much money they need to “save the world.” It’s always an astronomical amount and California’s program is already showing that the politicians there aren’t very concerned with saving the world since they’re already bending the rules to use it for non-climate change related projects AND removing restrictions for how it’s used by 2021.
Here is the link.
Fountainguy97
Member
Shocker. A record high recorded feet from a highway of asphalt. Media doesn’t even question it. Just runs with the doom and gloom hysteria.
Last edited:
snowlover91
Member
Looks like one of Greenland’s glaciers has reversed course and is now gaining mass instead of losing it. Interesting article here.
snowlover91
Member
Great article by Dr Roy Spencer about the recent heatwaves and how the media has failed to talk about the cold that has filtered into Eastern Europe.
“News reporting of the recent heat wave in France and other European countries was accompanied with the usual blame on humans for causing the event. For example, here’s the CBS News headline: Record-breaking heat is scorching France. Experts say climate change is to blame.
While it is possible that the human component of recent warming might have made the heat wave slightly worse, there are three facts the media routinely ignore when reporting on such “record hot” events. If these facts were to be mentioned, few people with the ability to think for themselves would conclude that our greenhouse gas emissions had much of an impact.
1. Record High Temperatures Occur Even Without Global Warming
The time period covered by reliable thermometer records is relatively short, even in Europe. Due to the chaotic nature of weather, record high and record low temperatures can be expected to occur from time to time, even with no long-term warming trend.
The question is, are the number of record high temperatures increasing over time? At least in the U.S., the answer is ‘no’, as the number of days over 100 and 105 deg. F have not increased (see Fig. 5 here). One would need to study the data for Europe to see if the number of record highs is increasing over time.
Then, even if they are increasing, one needs to determine the cause. Most of the warming since the Little Ice Age (up to about 1900) occurred before greenhouse gases could be blamed. We have no temperature measurements during the Medieval Warm Period of 1,000 years ago. How hot were some of the summer days back then? No one knows. Weather changes, which leads me to my next point.
2. Summer Heat Waves are Weather-Related, and Unusual Cold is Usually Nearby
The recent excessive heat in Europe wasn’t caused by summer air sitting there and cooking in a bath of increased human-emitted carbon dioxide. It was caused by a Saharan Air Layer (SAL) flowing in from that gigantic desert to the south.
This happens from time to time. Here’s what the temperature departures from normal looked like at ~ 5,000 ft. altitude:
 Fig. 1. GFS model depiction of the 850 hPa level (about 5,000 ft. altitude) temperature departures from normal at midday 29 June 2019, showing a hot Saharan air mass that had flowed north over western Europe, as a cold arctic air mass flowed south over eastern Europe. (Graphic courtesy of WeatherBell.com)
The SAL event flowed north from the Sahara Desert to cover western Europe while a cold air mass flowed south over eastern Europe. As evidence of just how large natural weather variations can be, the full range of temperature departures from normal just over this small section of the world spanned 25 deg. C (45 deg. F).
Meanwhile, the global average temperature anomaly for June (from NOAA’s Climate Forecast System, CFSv2 model) at the surface was only +0.3 deg. C (0.5 deg. F), and even for one day (July 1, 2019, from WeatherBell.com) remains at +0.3 deg. C.
Do you see the disparity between those two numbers?: weather-related temperature variations of 45 deg. F versus a climate-related global average “warmth” of only 0.5 deg. F.
Here’s what the situation looked like at the surface:
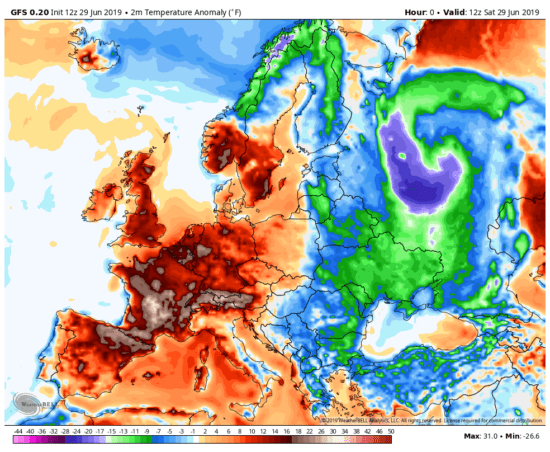 Fig. 2. As in Fig. 1, but for surface air temperature.
The range in surface air temperature departures from normal was was 32 deg. C (about 58 deg. F), again swamping (by a factor of 100) the global “climate” warmth of only 0.5 deg. F.
Thus, when we talk of new temperature records, we should be looking at normal weather variations first.
3. Most Thermometer Measurements Have Been Spuriously Warmed by the Urban Heat Island Effect
I am thoroughly convinced that the global thermometer record has exaggerated warming trends due to the Urban Heat Island (UHI) effect. When natural vegetation is replaced with buildings, pavement, and we add spurious heat sources like air conditioning units, cars, andice cream trucks, the microclimate around thermometer sites changes.
Many of us experience this on a daily basis as we commute from more rural surroundings to our jobs in more urban settings.
For example, Miami International Airport recently set a new high temperature record of 98 deg. F for the month of May. The thermometer in question is at the west end of the south runway at the airport, at the center of the Miami-Ft. Lauderdale metroplex. Only 120 years ago, virtually no one lived in Miami; in 1896 it had a population of 300.
The UHI effect is so strong and pervasive that it is now included in the GFS weather forecast model, and in the case of Miami’s recent hot spell, we see the metroplex at midnight was nearly 10 deg. F warmer than the rural surroundings:
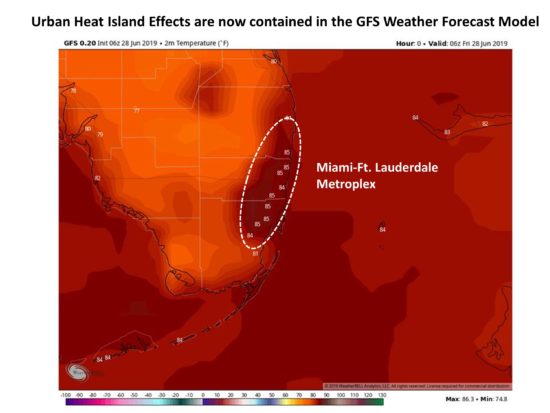 Fig. 3. GFS surface temperature analysis for around midnight, 28 May 2019.
When a thermometer site has that kind of spurious warming at night, it’s going to produce spuriously warm temperatures during the day (and vice versa).
The most thorough analysis of the UHI effect on U.S. temperature was by Anthony Watts and co-authors, who analyzed the siting of hundreds of thermometers around the U.S. and showed that if only the best (most rural) sited thermometers are used, U.S. warming trends are roughly cut in half. Curiously, they found that the official NOAA-adjusted temperature data (which uses both urban and rural data) has even more warming than if no UHI adjustments were made, leading many of us to conclude that the NOAA UHI adjustment procedure has made the rural data look like urban, rather than the other way around as it should be.
How does this impact the recent record high temperatures in France? There is no question that temperatures were unusually hot, I’m only addressing the reasons why high temperature records are set. I’ve already established that (1) record high temperatures will occur without global warming; (2) weather variations are the primary cause (in this case, an intrusion of Saharan air), and now (3) many thermometer sites have experienced spurious warming.
On this third point, this MeteoFrance page lists the temperature records from the event, and one location (Mont Aigoua) caught my eye because it is a high altitude observatory with little development, on a peak that would be well-ventilated. The previous high temperature record there from 1923 was beat by only 0.5 deg. C.
Some of the other records listed on that page are also from the early 20th Century, which naturally begs the question of how it could have been so hot back then with no anthropogenic greenhouse effect and little urban development.
The bottom line is that record high temperatures occur naturally, with or without climate change, and our ability to identify them has been compromised by spurious warming in most thermometer data which has yet to be properly removed.”
“News reporting of the recent heat wave in France and other European countries was accompanied with the usual blame on humans for causing the event. For example, here’s the CBS News headline: Record-breaking heat is scorching France. Experts say climate change is to blame.
While it is possible that the human component of recent warming might have made the heat wave slightly worse, there are three facts the media routinely ignore when reporting on such “record hot” events. If these facts were to be mentioned, few people with the ability to think for themselves would conclude that our greenhouse gas emissions had much of an impact.
1. Record High Temperatures Occur Even Without Global Warming
The time period covered by reliable thermometer records is relatively short, even in Europe. Due to the chaotic nature of weather, record high and record low temperatures can be expected to occur from time to time, even with no long-term warming trend.
The question is, are the number of record high temperatures increasing over time? At least in the U.S., the answer is ‘no’, as the number of days over 100 and 105 deg. F have not increased (see Fig. 5 here). One would need to study the data for Europe to see if the number of record highs is increasing over time.
Then, even if they are increasing, one needs to determine the cause. Most of the warming since the Little Ice Age (up to about 1900) occurred before greenhouse gases could be blamed. We have no temperature measurements during the Medieval Warm Period of 1,000 years ago. How hot were some of the summer days back then? No one knows. Weather changes, which leads me to my next point.
2. Summer Heat Waves are Weather-Related, and Unusual Cold is Usually Nearby
The recent excessive heat in Europe wasn’t caused by summer air sitting there and cooking in a bath of increased human-emitted carbon dioxide. It was caused by a Saharan Air Layer (SAL) flowing in from that gigantic desert to the south.
This happens from time to time. Here’s what the temperature departures from normal looked like at ~ 5,000 ft. altitude:
The SAL event flowed north from the Sahara Desert to cover western Europe while a cold air mass flowed south over eastern Europe. As evidence of just how large natural weather variations can be, the full range of temperature departures from normal just over this small section of the world spanned 25 deg. C (45 deg. F).
Meanwhile, the global average temperature anomaly for June (from NOAA’s Climate Forecast System, CFSv2 model) at the surface was only +0.3 deg. C (0.5 deg. F), and even for one day (July 1, 2019, from WeatherBell.com) remains at +0.3 deg. C.
Do you see the disparity between those two numbers?: weather-related temperature variations of 45 deg. F versus a climate-related global average “warmth” of only 0.5 deg. F.
Here’s what the situation looked like at the surface:
The range in surface air temperature departures from normal was was 32 deg. C (about 58 deg. F), again swamping (by a factor of 100) the global “climate” warmth of only 0.5 deg. F.
Thus, when we talk of new temperature records, we should be looking at normal weather variations first.
3. Most Thermometer Measurements Have Been Spuriously Warmed by the Urban Heat Island Effect
I am thoroughly convinced that the global thermometer record has exaggerated warming trends due to the Urban Heat Island (UHI) effect. When natural vegetation is replaced with buildings, pavement, and we add spurious heat sources like air conditioning units, cars, andice cream trucks, the microclimate around thermometer sites changes.
Many of us experience this on a daily basis as we commute from more rural surroundings to our jobs in more urban settings.
For example, Miami International Airport recently set a new high temperature record of 98 deg. F for the month of May. The thermometer in question is at the west end of the south runway at the airport, at the center of the Miami-Ft. Lauderdale metroplex. Only 120 years ago, virtually no one lived in Miami; in 1896 it had a population of 300.
The UHI effect is so strong and pervasive that it is now included in the GFS weather forecast model, and in the case of Miami’s recent hot spell, we see the metroplex at midnight was nearly 10 deg. F warmer than the rural surroundings:
When a thermometer site has that kind of spurious warming at night, it’s going to produce spuriously warm temperatures during the day (and vice versa).
The most thorough analysis of the UHI effect on U.S. temperature was by Anthony Watts and co-authors, who analyzed the siting of hundreds of thermometers around the U.S. and showed that if only the best (most rural) sited thermometers are used, U.S. warming trends are roughly cut in half. Curiously, they found that the official NOAA-adjusted temperature data (which uses both urban and rural data) has even more warming than if no UHI adjustments were made, leading many of us to conclude that the NOAA UHI adjustment procedure has made the rural data look like urban, rather than the other way around as it should be.
How does this impact the recent record high temperatures in France? There is no question that temperatures were unusually hot, I’m only addressing the reasons why high temperature records are set. I’ve already established that (1) record high temperatures will occur without global warming; (2) weather variations are the primary cause (in this case, an intrusion of Saharan air), and now (3) many thermometer sites have experienced spurious warming.
On this third point, this MeteoFrance page lists the temperature records from the event, and one location (Mont Aigoua) caught my eye because it is a high altitude observatory with little development, on a peak that would be well-ventilated. The previous high temperature record there from 1923 was beat by only 0.5 deg. C.
Some of the other records listed on that page are also from the early 20th Century, which naturally begs the question of how it could have been so hot back then with no anthropogenic greenhouse effect and little urban development.
The bottom line is that record high temperatures occur naturally, with or without climate change, and our ability to identify them has been compromised by spurious warming in most thermometer data which has yet to be properly removed.”
snowlover91
Member
Looks like one of Greenland’s glaciers has reversed course and is now gaining mass instead of losing it. Interesting article here.
And here is the NASA study with a nice GIF showing the growth.

“These images, produced using GLISTIN-A radar data as part of NASA's Oceans Melting Greenland (OMG) mission, show how much mass the glacier gained from 2016-17, 2017-18 and 2018-19. Areas with the most growth - about 33 yards (30 meters) - are shown in dark blue. Red areas represent thinning. The glacier grew 22-33 yards (20-30 meters) each year between 2016 and 2019.”
BHS1975
Member
From this article
https://www.usatoday.com/story/news...t-wave-globe-had-its-hottest-june/1628438001/
Climate scientist James Hansen, commenting on the heat wave to CBS News, said that "the chance of those extreme events in the pre-industrialized world was not zero, but it was negligibly small compared to the chance today. So you can say with a very high degree of confidence that this extreme event is a consequence of human-made climate change."
The study hasn’t been peer-reviewed yet, but the group uses methods that are widely considered valid in the scientific community.
Sent from my iPhone using Tapatalk
snowlover91
Member
From this article
https://www.usatoday.com/story/news...t-wave-globe-had-its-hottest-june/1628438001/
Climate scientist James Hansen, commenting on the heat wave to CBS News, said that "the chance of those extreme events in the pre-industrialized world was not zero, but it was negligibly small compared to the chance today. So you can say with a very high degree of confidence that this extreme event is a consequence of human-made climate change."
The study hasn’t been peer-reviewed yet, but the group uses methods that are widely considered valid in the scientific community.
Sent from my iPhone using Tapatalk
All I saw was James Hansen citing his normal talking points with 0 evidence to back up his claim.
Furthermore one of the studies linked said this “Although it is difficult to directly attribute this heat wave to climate change, such extreme weather events are expected to become more common as the planet continues to warm under increasing greenhouse gas concentrations.”
Another said “Most models show considerably different behaviour with respect to the quantitative increase in likelihood and severity, compared to the observations so the confidence in the quantitative modelling results in this study is low, compared with other studies. All models and observations qualitatively agree on a strong human influence in increasing heatwave risk. There is thus high confidence in the sign (increase) of the human contribution to the heatwave risk.”
They used computer models which didn’t even agree with one another on the level of human influence to such a degree they had LOW CONFIDENCE in the results and could only conclude that humans have had some degree of contribution to the heatwave but how little or much is unknown. That’s a big nothingburger especially since computer models time and again have proven to be wildly inaccurate (as we know in winter storms and seasonal forecasts showing a cold winter that never verified for us last year) and in simulating past and future events they can be really bad.
Furthermore you should read the article I posted. This heat wave is a normal weather event, heat waves happen, records are broken. That’s weather. I noticed the articles linked failed to mention the cold that was hammering Eastern Europe, I wonder why?
They fail also to mention the heat island effect which can artificially boost the temperatures in cities in heat waves. A great example was one I shared yesterday. It was 100F in town and as soon as I got a few miles outside the city limits the temp dropped 3 degrees and by the time I got to my house, in the country surrounded by trees and fields, it dropped another 3 degrees. So the city was 6 degrees hotter than my house in the country. Think about it for a minute. When you fill a city with concrete, metal, cars, etc all those surfaces act as a heat sink and boost temperatures in heat waves and at night. NASA did a study and found it can be as much as 20F warmer in cities vs the surrounding urban/rural areas. You think this doesn’t have an effect on our temperature records? It absolutely does, see below.
“The most thorough analysis of the UHI effect on U.S. temperature was by Anthony Watts and co-authors, who analyzed the siting of hundreds of thermometers around the U.S. and showed that if only the best (most rural) sited thermometers are used, U.S. warming trends are roughly cut in half. Curiously, they found that the official NOAA-adjusted temperature data (which uses both urban and rural data) has even more warming than if no UHI adjustments were made, leading many of us to conclude that the NOAA UHI adjustment procedure has made the rural data look like urban, rather than the other way around as it should be.
The bottom line is that record high temperatures occur naturally, with or without climate change, and our ability to identify them has been compromised by spurious warming in most thermometer data which has yet to be properly removed.”
BHS1975
Member
I suppose the heat island effect is causing this too 

Sent from my iPhone using Tapatalk


Sent from my iPhone using Tapatalk
Rosie
Member
84 in the Artic Circle this summed.All I saw was James Hansen citing his normal talking points with 0 evidence to back up his claim.
Furthermore one of the studies linked said this “Although it is difficult to directly attribute this heat wave to climate change, such extreme weather events are expected to become more common as the planet continues to warm under increasing greenhouse gas concentrations.”
Another said “Most models show considerably different behaviour with respect to the quantitative increase in likelihood and severity, compared to the observations so the confidence in the quantitative modelling results in this study is low, compared with other studies. All models and observations qualitatively agree on a strong human influence in increasing heatwave risk. There is thus high confidence in the sign (increase) of the human contribution to the heatwave risk.”
They used computer models which didn’t even agree with one another on the level of human influence to such a degree they had LOW CONFIDENCE in the results and could only conclude that humans have had some degree of contribution to the heatwave but how little or much is unknown. That’s a big nothingburger especially since computer models time and again have proven to be wildly inaccurate (as we know in winter storms and seasonal forecasts showing a cold winter that never verified for us last year) and in simulating past and future events they can be really bad.
Furthermore you should read the article I posted. This heat wave is a normal weather event, heat waves happen, records are broken. That’s weather. I noticed the articles linked failed to mention the cold that was hammering Eastern Europe, I wonder why?
They fail also to mention the heat island effect which can artificially boost the temperatures in cities in heat waves. A great example was one I shared yesterday. It was 100F in town and as soon as I got a few miles outside the city limits the temp dropped 3 degrees and by the time I got to my house, in the country surrounded by trees and fields, it dropped another 3 degrees. So the city was 6 degrees hotter than my house in the country. Think about it for a minute. When you fill a city with concrete, metal, cars, etc all those surfaces act as a heat sink and boost temperatures in heat waves and at night. NASA did a study and found it can be as much as 20F warmer in cities vs the surrounding urban/rural areas. You think this doesn’t have an effect on our temperature records? It absolutely does, see below.
“The most thorough analysis of the UHI effect on U.S. temperature was by Anthony Watts and co-authors, who analyzed the siting of hundreds of thermometers around the U.S. and showed that if only the best (most rural) sited thermometers are used, U.S. warming trends are roughly cut in half. Curiously, they found that the official NOAA-adjusted temperature data (which uses both urban and rural data) has even more warming than if no UHI adjustments were made, leading many of us to conclude that the NOAA UHI adjustment procedure has made the rural data look like urban, rather than the other way around as it should be.
The bottom line is that record high temperatures occur naturally, with or without climate change, and our ability to identify them has been compromised by spurious warming in most thermometer data which has yet to be properly removed.”
snowlover91
Member
I suppose the heat island effect is causing this too
Sent from my iPhone using Tapatalk
I've proposed some possible explanations for this previously. Their are various alternative theories out there as to what is causing the decline like the AMO + and - cycles, solar influence, NAO, Antarctic and other possible explanations. Manmade AGW isn't the only explanation and if you look at historical ice core proxies there have been studies that have uncovered significant rises and falls in the ice over thousands of years suggesting there are other forces at work. Ocean currents for example play a huge role in the melting of the ice (AMO).
Notice for example the cold phase of the AMO peaked in the 1970s which just so happened to be when ice extent peaked. Since then the AMO transitioned to a warmer phase and ice extent has decreased at the same time, a perfect match. I'm not claiming it is the cause but there are studies that have linked it to having a heavy influence on Arctic ice extent gains/losses over the decades.
Here's a reconstruction of Arctic ice extent going back to the early 1900s. Compare it with the AMO. Notice how closely the AMO and Artic ice extent are correlated.

There is far more to this than just AGW. Clearly if AGW was the cause the glacier I posted about wouldn't have slowly started reversing course in 2016. In the NASA study they actually attribute... wait for it... changes in the ocean currents as the reason for the glacier reversing course and growing. Imagine that, an alternative explanation that does have to do with AGW.
snowlover91
Member
84 in the Artic Circle this summed.
And over thousands, or as some believe millions/billions of years, what is "normal" for temperatures on earth? The Ice Age? The Medieval Warm Period? Something in between like we have now? What exactly is "normal" for earth when looking at the big picture?
BHS1975
Member
Well it’s normal for now.
Sent from my iPhone using Tapatalk
Sent from my iPhone using Tapatalk
Rosie
Member
Just made a statement, do not think 84 in the Artic is normal for any time.And over thousands, or as some believe millions/billions of years, what is "normal" for temperatures on earth? The Ice Age? The Medieval Warm Period? Something in between like we have now? What exactly is "normal" for earth when looking at the big picture?
MichaelJ
Member

It is pretty amazing that despite the relentless much warmer than normal met. falls and winters for a number of years in a row up in the Arctic, clearly symptomatic of GW, the summers have always been pretty much right at normal. It will very likely go back to much warmer than normal by Oct. at the latest.
BHS1975
Member
It is pretty amazing that despite the relentless much warmer than normal met. falls and winters for a number of years in a row up in the Arctic, clearly symptomatic of GW, the summers have always been pretty much right at normal. It will very likely go back to much warmer than normal by Oct. at the latest.
Once there is a large area of open water around the pole ie blue ocean event, that will change drastically.
Sent from my iPhone using Tapatalk
snowlover91
Member
It is pretty amazing that despite the relentless much warmer than normal met. falls and winters for a number of years in a row up in the Arctic, clearly symptomatic of GW, the summers have always been pretty much right at normal. It will very likely go back to much warmer than normal by Oct. at the latest.
I think the temperatures being capped have to do more with the ice holding them down, it takes an incredible amount of energy to melt ice. Much of this extra energy is going towards that. If we were ever to go ice free in summer you would see a spike in the temperatures for sure.
BHS1975
Member
I think the temperatures being capped have to do more with the ice holding them down, it takes an incredible amount of energy to melt ice. Much of this extra energy is going towards that. If we were ever to go ice free in summer you would see a spike in the temperatures for sure.
Once that happens and probably quickly, there’s no turning back as there will be a lot more heat stored in the ocean to keep the ice thin in the winter. Who knows what effect that will have for the rest of us but it probably won’t be good.
Sent from my iPhone using Tapatalk
UAH Global Temperature Update for June, 2019: +0.47 deg. C anomaly vs 1981-2010 average
"The linear warming trend since January, 1979 remains at +0.13 C/decade. This is 1.3 Deg. C/century"
http://www.drroyspencer.com/2019/07/uah-global-temperature-update-for-june-2019-0-47-deg-c/
"The linear warming trend since January, 1979 remains at +0.13 C/decade. This is 1.3 Deg. C/century"
http://www.drroyspencer.com/2019/07/uah-global-temperature-update-for-june-2019-0-47-deg-c/
pcbjr
Member
Just wish, for comaparison purposes, that graph went back a couple hundred years ...UAH Global Temperature Update for June, 2019: +0.47 deg. C anomaly vs 1981-2010 average
"The linear warming trend since January, 1979 remains at +0.13 C/decade. This is 1.3 Deg. C/century"
http://www.drroyspencer.com/2019/07/uah-global-temperature-update-for-june-2019-0-47-deg-c/
MichaelJ
Member
Just when will this happen? They have been predicting an ice free arctic in 2012, 2013, 2014, 2015, 2016, 2017, 2018, 2019. Sooner or later, they may get it right, perhaps by 2065?Once there is a large area of open water around the pole ie blue ocean event, that will change drastically.
Sent from my iPhone using Tapatalk
- Status
- Not open for further replies.