Thanks for the site! There looks to be a lot of really useful resources on there.KNMI Climate Explorer tool actually provides a work around to this where you can download the entire daily z500 dataset for 1900-2010 in one fell swoop. Hope this helps!
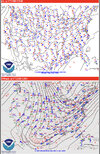
ERA-20C Daily 500mb Height Anomalies (KNMI Climate Explorer)
For the plot I made, I used CERA-20C, which is really an ensemble of ERA-20C, allowing for more accuracy. Unless I missed something, it doesn't appear to be on here.


