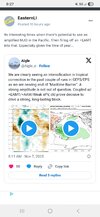
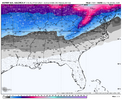
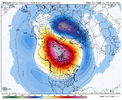
yeeeahh, I fell like this presents ice stormy somewhere later on.I wonder if this will possibly go something like 1998-99 did. If so, someone in NC and SC may be in for a MAJOR icestorm in late Dec or early Jan. Maybe both months just like that winter.
-
Hello, please take a minute to check out our awesome content, contributed by the wonderful members of our community. We hope you'll add your own thoughts and opinions by making a free account!
You are using an out of date browser. It may not display this or other websites correctly.
You should upgrade or use an alternative browser.
You should upgrade or use an alternative browser.
Wintry Winter 25-26 Winter Battle Zone
- Thread starter SD
- Start date
MRKEVIN7575
Member
I’m not sure that is a good analog because if you remember, December 1998 was very mild for the first half of the month. I think CLT might have had a 80 degree high the first week of that month. Things just flipped very quickly right before Christmas. With MJO following the track it’s on right now, like Webber has noted, we may be setting up to see below average for most of the month. Also as others have mentioned, thatI wonder if this will possibly go something like 1998-99 did. If so, someone in NC and SC may be in for a MAJOR icestorm in late Dec or early Jan. Maybe both months just like that winter.
-NAO/-PNA combo later this month is gonna spell a lot of CAD
tennessee storm
Member
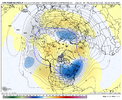
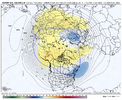
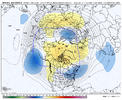
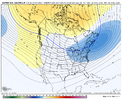
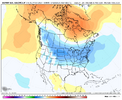
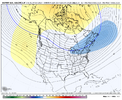
Ridge out west not very tall on those… meh kind ofAll 3 major ens looking rather similar View attachment 176208View attachment 176209View attachment 176210
Webberweather53
Meteorologist
Lol finally watched the OKC met who loves to hype try and predict the winter he wasn't very optimistic I was on the very southern edge of the "better conditions". Very average on everything pretty much
I don't trust these forecasts at all but that was quite underwhelming
He also didn't expect much til after Christmas
Southern Plains winters tend to be much more ENSO dependent than the Southeast US when it comes to snow at least.
The Texas Panhandle, west-central Oklahoma into western Kansas is the part of the conus that often consistently responds the most to La Niña and El Niño snowfall-wise
Brent
Member
Southern Plains winters tend to be much more ENSO dependent than the Southeast US when it comes to snow at least.
The Texas Panhandle, west-central Oklahoma into western Kansas is the part of the conus that often consistently responds the most to La Niña and El Niño snowfall-wise
Yeah I don't really think anyone knows if we're using that
We've had La Ninas barely snow and be absolutely horribly warm and we've also had some of the biggest winters recently on La Nina
I do feel like the better chances will be in January February though. The track record before that has certainly been iffy
They’re ensembles, that’s why they are smoothed out .Ridge out west not very tall on those… meh kind of
Which tells you a non-trivial number don't have a big ridge out west.They’re ensembles, that’s why they are smoothed out .
The signal for blocking in Canada is good though. The pattern being suggested looks like a pretty good pattern for the northern Plains, Great Lakes, and Northeast, with wedging into the Southeast.
tennessee storm
Member
The lack of snowfall up in Canada this time year is eye catching be honest .
Ridge over AK into the arctic circle is more important than a dumpy one centered up the WC imoWhich tells you a non-trivial number don't have a big ridge out west.
The signal for blocking in Canada is good though. The pattern being suggested looks like a pretty good pattern for the northern Plains, Great Lakes, and Northeast, with wedging into the Southeast.
Yeah 100%. I like the signal showing up for that. Ridging out west won't help a whole lot if Canada is filled with mild Pacific air.Ridge over AK into the arctic circle is more important than a dumpy one centered up the WC imo
Webberweather53
Meteorologist
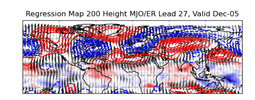
MJO + Equatorial Rossby Wave analog for early Dec.
Great looking pattern and mostly in line what’s been forecast on the models for a while now (especially the Euro weeklies below). Oth, my main concern is that we may run the risk of suppressing things too much given we’re in a Nina winter
https://www.atmos.albany.edu/facstaff/roundy/waves/rmmcyc/indexmjoertap.html


Webberweather53
Meteorologist
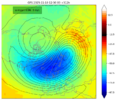
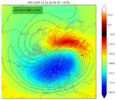
Fwiw, next week’s -NAO on the GFS does extend up into the lower stratosphere (100mb)
https://weatheriscool.com/page1/
500mb height anomalies
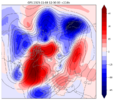
100mb height anomalies
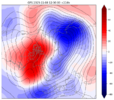
https://weatheriscool.com/page1/
500mb height anomalies

100mb height anomalies

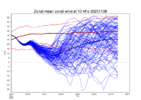
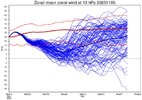
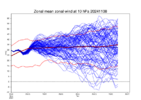
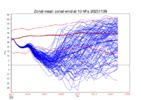
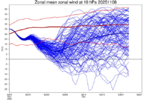
Both the 06z and 12z runs of the GFS got the zonal wind down to 2 m/s at the end of the runToday’s Euro 10 mb got slightly weaker than last 2 days and I’d call it 2nd best only barely behind 3 days ago (depends on criteria): once again it’s showing a real threat of earliest SSWE since 1968!
View attachment 176246
3 days ago:
View attachment 176247
1 year ago: near avg/much stronger than ‘25:
View attachment 176250
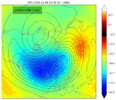
MRKEVIN7575
Member
It only takes one system to get an area normal for snow or close to it. Am hopeful we get into a favorable pattern that supports just that
Some thoughts on the stratospheric polar vortex (SPV) and the direction ahead...
The SPV is forecast to warm and weaken steadily over the next 3 weeks
I like this wording here regarding the classification of stratospheric warmings from Karin Labitzke & Barbara Naujokat on the SPARC web page (Stratospheric Processes And their Role in Climate) where the distinction is made between early winter warmings that briefly change the zonal wind direction, but don’t lead to a breakdown of the SPV <VS> major midwinter warmings which are associated with the breakdown of the SPV and the SPV being replaced by high pressure.
Canadian Warmings often happen in early winter. They take place when the Aleutian stratospheric high intensifies and moves poleward. The Canadian warmings can reverse the meridional temperature gradient and sometimes briefly change the zonal wind direction over the polar cap, but nevertheless they do not lead to a breakdown of the cyclonic polar vortex.
Major Midwinter Warmings occur mostly in January-February. In addition to warming of the north polar region and reversal of the meridional temperature gradient, they are also associated with a breakdown of the polar vortex, which is replaced by a high. That is, the definition of a Major Midwinter Warming requires not only the warming but also a total change of circulation. The definition of a breakdown of the polar vortex is that the usual westerlies in the Arctic at 10 hPa are replaced by easterlies so that the centre of the vortex moves south of 60-65°N. The vortex is either displaced entirely or split into two.
Reference: Lower Arctic Stratosphere in Winter since 1952 Newsletter 15
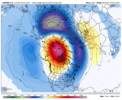
Our current situation in the stratosphere fits with the Canadian Warming description whereby the forecasted intensification of the Aleutian High in the stratosphere leads to a displaced and weakened SPV. This is a Wave 1 pattern which simply means that there is 1 high pressure and 1 low pressure located high in the stratosphere over the northern hemisphere, as seen here on this model forecast chart at 10mb where the high is centered over Alaska, and the low is centered over Scandinavia / NW Russia
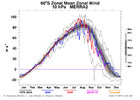
The magnitude of this Wave 1 pattern can be viewed on the MERRA2 charts from NASA. In the image below, the blue line is from last winter, the red/pink line is the current year, with the orange portion being the forecasted values from the NASA GEOS model. The near record high values indicate the previous and forecasted higher-than-normal Wave 1 amplitude.
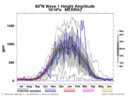
What is causing this Wave 1 pattern?
Dr. Amy Butler showed in this image in her climate.gov blog post the common precursor patterns in the troposphere for creating high Wave 1 and Wave 2 amplitudes which lead to warmings in the stratosphere.
Reference: Cooking up a stratospheric polar vortex disruption | NOAA Climate.gov
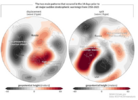
The forecasted 7-day averaged pattern for Nov 16 to Nov 23 matches well with the Wave 1 precursor pattern, with a low anomaly from the Aleutian Islands into E Asia and a high anomaly centered over southern Greenland. This type of pattern helps to amplify climatological / normal, standing planetary waves that propagate upward from the troposphere into the stratosphere, which warm and weaken the SPV.
The analogy I would use is having 2 people jump on a trampoline. Person 1 jumps on the trampoline at a steady, consistent pace. Person 2 times the jump so as to land on the trampoline right at the time when the trampoline has been pressed down by Person 1. This creates increased spring in the trampoline, leading to Person 2 having an amplified / higher jump (i.e. constructive wave interference). Person 1 is the climatological, standing planetary wave, and Person 2 is the Wave 1 tropospheric precursor wave pattern for SPV weakening.
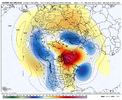
Another potential source of enhanced Wave 1 amplitude is East Asian Mtn Torque (+EAMT) which is forecasted to occur in conjunction with the aforementioned Wave 1 precursor pattern, as seen here with surface high pressure moving into E Asia in mid-Nov.
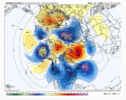
How much SPV weakening will occur?
The amount of SPV weakening will in large part depend on the strength and length of time match with the Wave 1 SPV weakening precursor pattern and the magnitude of the +EAMT.
What does it mean going forward?
Research from Dr. Simon Lee states that -NAO patterns are 7 times more likely to occur when the lower stratosphere (100 mb) is in a weak state. In the current setup, it looks like both the upper stratosphere (10 mb) and lower stratosphere will be conducive to warming and weakening. We can see the forecasted weakening at 100 mb (pink & orange line) from the NASA GEOS model
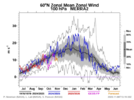
In addition, -NAO patterns are favored during La Nina as the MJO propagates from phases 7-8-1. Current MJO forecasts depict the MJO slowly moving thru phases 7-8 in the early to mid-December timeframe.
Reference: ENSO Modulation of MJO Teleconnections to the North Atlantic and Europe - Lee - 2019 - Geophysical Research Letters - Wiley Online Library
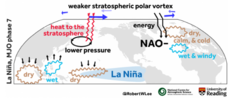
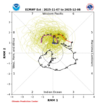
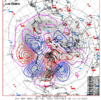
One of the top analogs that has been consistently showing up on the CPC extended range forecasts is late November of 1981.
Continued on next post.....lol
The SPV is forecast to warm and weaken steadily over the next 3 weeks

I like this wording here regarding the classification of stratospheric warmings from Karin Labitzke & Barbara Naujokat on the SPARC web page (Stratospheric Processes And their Role in Climate) where the distinction is made between early winter warmings that briefly change the zonal wind direction, but don’t lead to a breakdown of the SPV <VS> major midwinter warmings which are associated with the breakdown of the SPV and the SPV being replaced by high pressure.
Canadian Warmings often happen in early winter. They take place when the Aleutian stratospheric high intensifies and moves poleward. The Canadian warmings can reverse the meridional temperature gradient and sometimes briefly change the zonal wind direction over the polar cap, but nevertheless they do not lead to a breakdown of the cyclonic polar vortex.
Major Midwinter Warmings occur mostly in January-February. In addition to warming of the north polar region and reversal of the meridional temperature gradient, they are also associated with a breakdown of the polar vortex, which is replaced by a high. That is, the definition of a Major Midwinter Warming requires not only the warming but also a total change of circulation. The definition of a breakdown of the polar vortex is that the usual westerlies in the Arctic at 10 hPa are replaced by easterlies so that the centre of the vortex moves south of 60-65°N. The vortex is either displaced entirely or split into two.
Reference: Lower Arctic Stratosphere in Winter since 1952 Newsletter 15
Our current situation in the stratosphere fits with the Canadian Warming description whereby the forecasted intensification of the Aleutian High in the stratosphere leads to a displaced and weakened SPV. This is a Wave 1 pattern which simply means that there is 1 high pressure and 1 low pressure located high in the stratosphere over the northern hemisphere, as seen here on this model forecast chart at 10mb where the high is centered over Alaska, and the low is centered over Scandinavia / NW Russia

The magnitude of this Wave 1 pattern can be viewed on the MERRA2 charts from NASA. In the image below, the blue line is from last winter, the red/pink line is the current year, with the orange portion being the forecasted values from the NASA GEOS model. The near record high values indicate the previous and forecasted higher-than-normal Wave 1 amplitude.

What is causing this Wave 1 pattern?
Dr. Amy Butler showed in this image in her climate.gov blog post the common precursor patterns in the troposphere for creating high Wave 1 and Wave 2 amplitudes which lead to warmings in the stratosphere.
Reference: Cooking up a stratospheric polar vortex disruption | NOAA Climate.gov

The forecasted 7-day averaged pattern for Nov 16 to Nov 23 matches well with the Wave 1 precursor pattern, with a low anomaly from the Aleutian Islands into E Asia and a high anomaly centered over southern Greenland. This type of pattern helps to amplify climatological / normal, standing planetary waves that propagate upward from the troposphere into the stratosphere, which warm and weaken the SPV.
The analogy I would use is having 2 people jump on a trampoline. Person 1 jumps on the trampoline at a steady, consistent pace. Person 2 times the jump so as to land on the trampoline right at the time when the trampoline has been pressed down by Person 1. This creates increased spring in the trampoline, leading to Person 2 having an amplified / higher jump (i.e. constructive wave interference). Person 1 is the climatological, standing planetary wave, and Person 2 is the Wave 1 tropospheric precursor wave pattern for SPV weakening.

Another potential source of enhanced Wave 1 amplitude is East Asian Mtn Torque (+EAMT) which is forecasted to occur in conjunction with the aforementioned Wave 1 precursor pattern, as seen here with surface high pressure moving into E Asia in mid-Nov.

How much SPV weakening will occur?
The amount of SPV weakening will in large part depend on the strength and length of time match with the Wave 1 SPV weakening precursor pattern and the magnitude of the +EAMT.
What does it mean going forward?
Research from Dr. Simon Lee states that -NAO patterns are 7 times more likely to occur when the lower stratosphere (100 mb) is in a weak state. In the current setup, it looks like both the upper stratosphere (10 mb) and lower stratosphere will be conducive to warming and weakening. We can see the forecasted weakening at 100 mb (pink & orange line) from the NASA GEOS model

In addition, -NAO patterns are favored during La Nina as the MJO propagates from phases 7-8-1. Current MJO forecasts depict the MJO slowly moving thru phases 7-8 in the early to mid-December timeframe.
Reference: ENSO Modulation of MJO Teleconnections to the North Atlantic and Europe - Lee - 2019 - Geophysical Research Letters - Wiley Online Library


One of the top analogs that has been consistently showing up on the CPC extended range forecasts is late November of 1981.

Continued on next post.....lol
Last edited:
Continued...
Wave 1 Displacement / Canadian Warming SSW occurred on 12/4/81
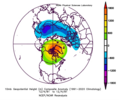
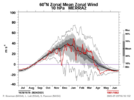
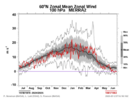
Another analog year to consider is Nov-Dec 2000 where a Canadian Warming also occurred, but the SPV wasn’t weakened enough to reach an official SSW. However, the upper and lower stratosphere were both in a weak state from early November to late December.
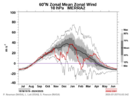
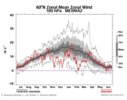
In comparing those 2 analog years, one can see that SPV weakening occurred in both years. However, the lower stratosphere was in a weaker state in the year where an official SSW wasn’t quite reached (2000). The point is, the SPV weakening in the lower stratosphere can assist -NAO development in spite of official SSW designation. Each case differs, and you can see in the case of 1981 that the SPV weakening (and SSW) was a quick in and out with the lowered 10mb zonal winds.
But -NAO blocking episodes occurred in both analog years.
In the case of 2000, -NAO episodes (-0.50 or lower daily value used) occurred:
11/22 to 12/9 (18 days)
12/19 to 12/30 (12 days)
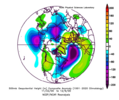
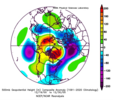
In the case of 1981-1982 a -NAO episode occurred:
12/24 to 1/11 (19 days)
The MJO was in phases 8-1-2-3-4 during the blocking episode
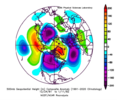
Putting it all together…
The SPV will likely weaken over the next few weeks due to the forecasted Wave 1 precursor pattern and +EAMT episode.
I would say there is a 30 to 50% chance that the weakening will be extensive enough to be classified as an official Canadian Warming SSW.
I would expect weakening of the SPV to occur at both the upper (10 mb) and lower (100 mb) stratosphere levels, with the weakening at 100 mb to extend thru much of December.
Thus, the threat for episodic -NAO blocking will be elevated from mid-November thru December, potentially lasting into early January.
The MJO passing thru phases 7-8-1-2 in the early December to early January timeframe should favor increasing AK and western North America ridging (-EPO / +PNA) in the mid-December to early January timeframe.
Wave 1 Displacement / Canadian Warming SSW occurred on 12/4/81


Another analog year to consider is Nov-Dec 2000 where a Canadian Warming also occurred, but the SPV wasn’t weakened enough to reach an official SSW. However, the upper and lower stratosphere were both in a weak state from early November to late December.


In comparing those 2 analog years, one can see that SPV weakening occurred in both years. However, the lower stratosphere was in a weaker state in the year where an official SSW wasn’t quite reached (2000). The point is, the SPV weakening in the lower stratosphere can assist -NAO development in spite of official SSW designation. Each case differs, and you can see in the case of 1981 that the SPV weakening (and SSW) was a quick in and out with the lowered 10mb zonal winds.
But -NAO blocking episodes occurred in both analog years.
In the case of 2000, -NAO episodes (-0.50 or lower daily value used) occurred:
11/22 to 12/9 (18 days)
12/19 to 12/30 (12 days)


In the case of 1981-1982 a -NAO episode occurred:
12/24 to 1/11 (19 days)
The MJO was in phases 8-1-2-3-4 during the blocking episode

Putting it all together…
The SPV will likely weaken over the next few weeks due to the forecasted Wave 1 precursor pattern and +EAMT episode.
I would say there is a 30 to 50% chance that the weakening will be extensive enough to be classified as an official Canadian Warming SSW.
I would expect weakening of the SPV to occur at both the upper (10 mb) and lower (100 mb) stratosphere levels, with the weakening at 100 mb to extend thru much of December.
Thus, the threat for episodic -NAO blocking will be elevated from mid-November thru December, potentially lasting into early January.
The MJO passing thru phases 7-8-1-2 in the early December to early January timeframe should favor increasing AK and western North America ridging (-EPO / +PNA) in the mid-December to early January timeframe.
Webberweather53
Meteorologist
The Antarctic Polar Vortex is undergoing a final stratospheric warming event over the next few weeks
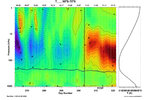
You can see the effect this is about to have on the tropical lower stratosphere & upper troposphere.
As the descending portion of the Brewer Dobson Circulation (BDC) over the southern pole accelerates/warms in a stratospheric warming event, the equatorial portion of the BDC accelerates upward to compensate, leading to cooling thru adiabatic effects. This cooling can enhance tropical convection, especially over the Warm Pool, possibly giving the MJO a boost as it circulates over the West Pacific
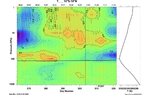

Webberweather53
Meteorologist
The negative nao showing up simultaneously with the weakening of the stratospheric polar vortex at the end of November into December is likely going to pay dividends right off the bat if the warming event can reach the lower stratosphere (100 hPa).
View attachment 176010
View attachment 176009
The preceding tropospheric NAM/AO/NAO state is a critical factor for determining if a stratospheric warming event can couple to the troposphere, as Black & McDaniel (2004) showed a few decades ago (link below).
I.e. if the AO/NAO is negative while a sudden stratospheric warming event is happening, it is much more likely to couple to the troposphere and the surface impacts tend to be stronger and more immediate
https://journals.ametsoc.org/view/journals/clim/17/20/1520-0442_2004_017_3990_dcsotn_2.0.co_2.xml
As we discussed a while back, the lag between sudden stratospheric warming events and the troposphere is usually much shorter when the troposphere NAM/AO is already in a negative state prior to the warming events. That's generally what we're seeing on NWP models as we get towards the end of this coming week and beyond.
The -NAO that develops late week gets rooted into the lower stratosphere (100mb) almost right off the bat on the ECMWF & GEFS
ECMWF 100mb forecast height anomalies at day 10
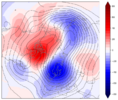
500mb forecast
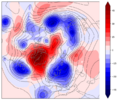
GEFS 500mb day 9 forecast
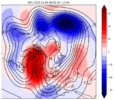
GEFS 100mb day 9 forecast
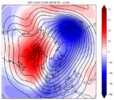
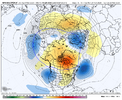
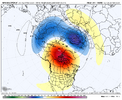
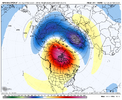
Later in week 2 on the GEFS, this vertical coupling between the tropospheric -NAO & Canadian Warming event strengthens even more, extending up into at least the middle stratosphere (~30-50mb). The main implication of this coupling is it will likely lead to a much longer-lasting and more intense -NAO/-AO/-EPO event in December.
MRKEVIN7575
Member
So far so good eric. Hoping we can get a few winter events in that set-up in our areaAs we discussed a while back, the lag between sudden stratospheric warming events and the troposphere is usually much shorter when the troposphere NAM/AO is already in a negative state prior to the warming events. That's generally what we're seeing on NWP models as we get towards the end of this coming week and beyond.
The -NAO that develops late week gets rooted into the lower stratosphere (100mb) almost right off the bat on the ECMWF & GEFS
ECMWF 100mb forecast height anomalies at day 10
View attachment 176293
500mb forecast
View attachment 176294
GEFS 500mb day 9 forecast
View attachment 176295
GEFS 100mb day 9 forecast
View attachment 176296
Later in week 2 on the GEFS, this vertical coupling between the tropospheric -NAO & Canadian Warming event strengthens even more, extending up into at least the middle stratosphere (~30-50mb). The main implication of this coupling is it will likely lead to a much longer-lasting and more intense -NAO/-AO/-EPO event in December.
View attachment 176297
View attachment 176299
View attachment 176298
Webberweather53
Meteorologist
MRKEVIN7575
Member
Eric, will you show like you did last year in the pacific with the sst configuration if it favors a -epo this winter just based on that? Hopefully that makes sense lolEPS shows our MJO event rolling into the Western Hemisphere (phase 8) in early December, while the stratospheric polar vortex weakens & almost immediately couples to the tropospheric -NAO that develops near the end of this week.
Everything is going to plan
View attachment 176306
MRKEVIN7575
Member
Kevin, I’m running this by the skeptics to see if they’ll comment.
Webberweather53
Meteorologist
olhausen
Member
It almost always is January February around these parts. Hell even March cranks out more snow here then December. I’ve never had a snow bigger than 2 inches in December. January has had the most big snows. A 12, 8, 7 and multiple 6 inch events all in January.Yeah I don't really think anyone knows if we're using that
We've had La Ninas barely snow and be absolutely horribly warm and we've also had some of the biggest winters recently on La Nina
I do feel like the better chances will be in January February though. The track record before that has certainly been iffy
Euro Weeklies: coldest run yet for each of 1st 3 weeks in Dec for US overall. Intense cold still doesn’t penetrate deep into the SE, but I’ll still take it as the 3 maps don’t even have a speck of warmer than normal in the entire Conus except for S TX and S/C FL.
MRKEVIN7575
Member
Im hopeful we have enough cold with moisture in our area!!Euro Weeklies: coldest run yet for each of 1st 3 weeks in Dec for US overall. Intense cold still doesn’t penetrate deep into the SE, but I’ll still take it as the 3 maps don’t even have a speck of warmer than normal in the entire Conus except for S TX and S/C FIm ho
Last edited:
Tsappfrog20
Member
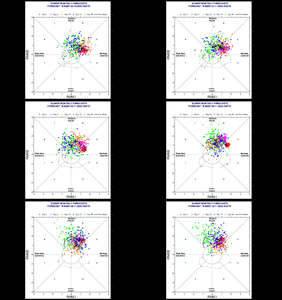
Over the past 12 days, the trend on the forecast of the Euro Monthly ensemble members has been for an increasing amplitude of the MJO wave as it pushes into Phase 7 (green dots)
View attachment 176401
Is that a good thing to happen? Sorry I am new to understanding MJO I know the best Phases are 8-1-2
Sent from my iPhone using Tapatalk
MRKEVIN7575
Member
If it materializes, it should turn colder and maybe stormier for a little whileIs that a good thing to happen? Sorry I am new to understanding MJO I know the best Phases are 8-1-2
Sent from my iPhone using Tapatalk
It’s a good sign as there is always this sort of underlying fear that the MJO wave isn’t going to push into and thru phase 7-8 and on into 1-2. MJO 4-5 is when the convection / thunderstorm signal is being enhanced in the Maritime Continent along the equator. We don’t want the MJO camping out in there as that tends to favor trough / ridge patterns that bring us warmer conditionsIs that a good thing to happen? Sorry I am new to understanding MJO I know the best Phases are 8-1-2
Sent from my iPhone using Tapatalk
MRKEVIN7575
Member
If it materializes, it should turn colder and maybe stormier for a little while
Griteater, will the mjo wave have to be strong enough to make it to the colder phases in your opinion?It’s a good sign as there is always this sort of underlying fear that the MJO wave isn’t going to push into and thru phase 7-8 and on into 1-2. MJO 4-5 is when the convection / thunderstorm signal is being enhanced in the Maritime Continent along the equator. We don’t want the MJO camping out in there as that tends to favor trough / ridge patterns that bring us warmer conditions

