Welp here we go, first time ever posting a thread, but anyways here’s the learning thread ! ???
-
Hello, please take a minute to check out our awesome content, contributed by the wonderful members of our community. We hope you'll add your own thoughts and opinions by making a free account!
You are using an out of date browser. It may not display this or other websites correctly.
You should upgrade or use an alternative browser.
You should upgrade or use an alternative browser.
Learning Learning about weather (soundings, H5, etc..)
- Thread starter Myfrotho704_
- Start date
I guess I’ll go ahead and start the basics,
This right here is a snow sounding, whole column is below freezing and the dendritic growth zone (on the left) is moist, if you see a dry dgz even with a sounding that would support snow, you’re either getting freezing drizzle, freezing rain or rain/drizzle, snowflakes cannot form in a very dry DGZ
This right here is a snow sounding, whole column is below freezing and the dendritic growth zone (on the left) is moist, if you see a dry dgz even with a sounding that would support snow, you’re either getting freezing drizzle, freezing rain or rain/drizzle, snowflakes cannot form in a very dry DGZ
This is a sleet sounding, there’s warm air advection around 800-850 hPa allowing for a melting layer, then right below 850 hPa to the surface things go below freezing again, raindrops are able to freeze in this layer allowing sleet, you can see the wind barbs on the right, there suggesting winds from the w/sw, almost 100% of the time, that means your getting WAA 
Here’s are most common sounding in the SE, a rain sounding, everything from 700 hPa to the surface is above freezing, there is no refreezing layer so it stays liquid, now freezing rain happens when the surface temp is below freezing (32F), temp in this sounding is 35 degrees so it’s a very cold rain but not freezing ")

Here’s something you may have seen on a sounding before, it used to confuse the hell outa me lol but this is pretty much the amount of lift you getting in the atmosphere, if you see this inside the DGZ with a snow sounding, that typically means your getting a good burst of snow, the bigger the bars/more negative numbers you get into, that means more lift, just think of this as lift 
I think this is a great idea and I hope some of the severe weather guys will chime in too!
This is a thunderstorm sounding, when you see those dotted lines in a sounding, that normally indicates cape, CAPE is basically the amount of energy A parcel would have if lifted up into the the atmosphere, in this sounding, there’s 2267 jkg of CAPE, that’s pretty unstable, the higher the CAPE, typically you end up with more explosive updraft development, but that’s if you have some type of forcing (outflow, cold front, warm front, lee trough, etc 
why was there thunder when it was cold as heck outside yesterday/this morning !? Something called elevated convection, they develop differently then surface based thunderstorms, they mostly develop off of MUcape, in this sounding there is a inversion, the thunderstorm develops above this inversion because above 850 hPa the air is unstable until it hits the equilibrium layer (layer where air become stable and convection stops). With these types of storms they can’t develop from the surface because the inversion is stable meaning IT can’t support storm growth, The reason for the unusually loud thunder is sound getting trapped under this inversion, thunder can sound enhanced with this in place and can have the typical rolling sound 
@Myfrotho704_ instead of liking each post I'm just going to say thanks man, your visual explanations are fantastic. Way to get it going
Yes this is why I have always loved this site. Instead of a bunch of snarky comments, I believe this is very important to a lot of people on this board.@Myfrotho704_ instead of liking each post I'm just going to say thanks man, your visual explanations are fantastic. Way to get it going
Saw this on tonights GFS and just wanted to point it out. See the inversion right above the surface?(The little sharp turn to the right with the red line) Its called decoupling the boundary layer which kills low level instability and laspe rates. The GFS has a bias in wrongly doing this during severe weather events.
Attachments
pcbjr
Member
Once this thread gets a tiny bit more populated, I'm going to get it archived in a choice spot in our Wiki ...
Here is the perfect example of a "loaded gun" sounding.
A few things of note. Deep moisture from the surface to 700mb, with a strong EML and cap on top. It also has almost 90 degrees wind turning with height with the 500mb wind out of the WSW. High cape numbers and very high surface laspe rates.
A few things of note. Deep moisture from the surface to 700mb, with a strong EML and cap on top. It also has almost 90 degrees wind turning with height with the 500mb wind out of the WSW. High cape numbers and very high surface laspe rates.
Good stuff @Arcc , anyways a EML is a important part of severe weather, Normally it occurs with Capping, once the CAP breaks explosive/violent updraft development is typical, this Can isolate storms more often aswell leading to more discrete activity, normally with a EML you get dry air aloft and a area between 3km-6km with a “near dry or dry adiabatic lapse rate” , typically chances of severe is increased like arcc mentioned with this, typically the stronger the EML, the less mixing you get which mixing kills CAPE, EML’s originate from the desert SW, no wonder it’s somewhat common in the Great Plains during severe WX, but it can make it to the east coast, it won’t be quite as strong/the same tho as if it was in the desert SW/plains

Last edited:
pcbjr
Member
Folks,
Some really, really good info here ... but more is needed to fill this out ... Please contribute ...
Some really, really good info here ... but more is needed to fill this out ... Please contribute ...
Why do the storms in the summer have such strong winds with them even without the shear ? Term called a wet microburst, often times lower levels (sfc- range from 850-700 hPa is saturated altho you may have a little bit of a inverted V but that is more typical with dry microbursts, anyways above that moist layer, there’s dry air entertainment, dry air aloft typically gets “entrained” or pulled into the downdraft, this can cause a lot of evaporative cooling, that then causes negative buoyancy (think of negative buoyancy as sinking ), this causes a stronger downdraft and what’s called a “wet microburst” these are often mistaken for tornadoes sometimes, they mostly correlate with straight line wind damage, these events are also a danger to airplanes, it’s somewhat typical to get a shelf cloud with these events aswell
you can tell sometimes that a storm is producing a microburst by rain near the ground appearing to look “spread out” due to the amount of downward energy and the act a gravity pulling those raindrops/wind down and it hitting the ground so it looks spread out

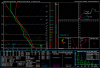
————————————————————-Here’s a good example of wet microbursts on radar, sometimes you can tell there’s a downburst if the storm has a 55+ DBZ core, but you can really see downburst signatures on base velocity, you can see the strong wind/rain divergence on base velocity, normally tho microburst are short lived and die out but can release a new outflow to allow another storm to form ————————————————————-heres your average wet microburst sounding, Higher CAPE can aid stronger downdrafts (more rain/hail falling into dry layer), you can see that dry air above 750 hPa, note the more moist layer below it and that tiny little inverted V, bottom line, if you see a sounding with decent CAPE, dry air above a moist layer, know there’s a chance for a strong storm with a chance of a downburst
you can tell sometimes that a storm is producing a microburst by rain near the ground appearing to look “spread out” due to the amount of downward energy and the act a gravity pulling those raindrops/wind down and it hitting the ground so it looks spread out
————————————————————-Here’s a good example of wet microbursts on radar, sometimes you can tell there’s a downburst if the storm has a 55+ DBZ core, but you can really see downburst signatures on base velocity, you can see the strong wind/rain divergence on base velocity, normally tho microburst are short lived and die out but can release a new outflow to allow another storm to form
————————————————————-heres your average wet microburst sounding, Higher CAPE can aid stronger downdrafts (more rain/hail falling into dry layer), you can see that dry air above 750 hPa, note the more moist layer below it and that tiny little inverted V, bottom line, if you see a sounding with decent CAPE, dry air above a moist layer, know there’s a chance for a strong storm with a chance of a downburst
Last edited:
There’s also something called a “dry microburst”, those are pretty rare in the SE, typically with dry microbursts you get a big “inverted V and it’s very dry at the low levels but mid levels are more moist, mid levels can be dry but the more saturated mid levels are the more of a dry microburst threat you have, with these events you typically get high cloud bases, rain/hail falls into the dry layer (inverted V area) and causes evaporative cooling, this causes negative buoyancy (sinking) and causes strong winds to plummet to the ground and spread out, normally no precipitation makes it to the ground making these events really dangerous with dust, spreading fires caused from Cloud to ground lightning, threat to airplanes, these are more common in desert climates

Just gonna leave a reminder to myself over here to break down HP supercells, LP supercells and classic supercells tommorow ??
IN THE MOST REDNECK TERMS POSSIBLE CAN SOMEONE BREAK THIS DOWN? IM TRYING TO EXPLAIN IT TO A FEW COWORKERS BUT HAVING DIFFICULTY

IN THE MOST REDNECK TERMS POSSIBLE CAN SOMEONE BREAK THIS DOWN? IM TRYING TO EXPLAIN IT TO A FEW COWORKERS BUT HAVING DIFFICULTY
View attachment 16506
Decent CAPE sounding altho it is on the lower side, decent 0-6km shear aswell, storm relative helicity is pretty high, but this sounding is lacking in richer moisture supportive of tornadoes at the surface through the column, also storms would move due west based off storm slinky, and oh yeah 0-3km lapses/CAPE is lacking aswell which is another limiting factor
Last edited:
Decent CAPE sounding altho it is on the lower side, decent 0-6km shear aswell, storm relative helicity is pretty high, but this sounding is lacking in richer moisture supportive of tornadoes at the surface through the column, also storms would move due west based off storm slinky, and oh yeah 0-3km lapses/CAPE is lacking aswell which is another limiting factor
WHEN YOU GET TIME CAN YOU POINT OUT THE CAPE, SHEAR, HELICITY, AND OTHER PARAMETERS SO THEY CAN UNDERSTAND WITH A VISUAL AIDE? WANT TO MAKE SURE IM TELLING THEM THE RIGHT INFO
metfascination
Member
This is a great contribution for those like me that are climbing a steep learning curve. Much thanks!
Sent from my iPhone using Tapatalk
Sent from my iPhone using Tapatalk
You can learn a good bit of stuff from TIm Vasquez here:
https://www.youtube.com/user/timwxx/videos?view=0&sort=dd&shelf_id=1
It's older stuff, but he goes over a lot of things in his videos.
https://www.youtube.com/user/timwxx/videos?view=0&sort=dd&shelf_id=1
It's older stuff, but he goes over a lot of things in his videos.
I found a really good website on 3 types of supercells, HP, LP and classic, I’ve been real busy lately and have lots of work to make up so here you go
https://www.weather.gov/media/lmk/soo/Supercell_Structure.pdf
https://www.weather.gov/media/lmk/soo/Supercell_Structure.pdf
tractor girl
Member
This is a thunderstorm sounding, when you see those dotted lines in a sounding, that normally indicates cape, CAPE is basically the amount of energy A parcel would have if lifted up into the the atmosphere, in this sounding, there’s 2267 jkg of CAPE, that’s pretty unstable, the higher the CAPE, typically you end up with more explosive updraft development, but that’s if you have some type of forcing (outflow, cold front, warm front, lee trough, etc View attachment 16211
I notice several CAPE values at the bottom of the chart: SBCAPE, MJCAPE and DCAPE. What is the difference between each? Which should we look first when looking at a sounding?

I notice several CAPE values at the bottom of the chart: SBCAPE, MJCAPE and DCAPE. What is the difference between each? Which should we look first when looking at a sounding?
View attachment 17416
Its really convective energy at different levels and points for layman terms. For instance SBcape stands for surface based cape which is the convective energy starting at ground level. DCape is downdraft cape which us used to determine the strength of downdrafts. Presence of MLCape with low SBcape tells you that there is a cap and any convection at that point would be elevated.
I look at SBcape first and then on most soundings you will see 0-3km Cape which I look at next.
Thanks for the great information and explanations. I have been seeing these graphs for years and never could quite grasp what it was telling me. After this thread, I have a much better idea. Still not all the way there, but gaining on it.
Welcome aboard!Thanks for the great information and explanations. I have been seeing these graphs for years and never could quite grasp what it was telling me. After this thread, I have a much better idea. Still not all the way there, but gaining on it.
one heck of a website If you want to learn more, I’ll write up my own things again once I get a week worth of school make up work/projects done
https://www.weather.gov/media/lmk/soo/SvrWx_Fcstg_TipSheet.pdf
https://www.weather.gov/media/lmk/soo/SvrWx_Fcstg_TipSheet.pdf
Setting spring severe aside when looking for summer tstorms would you look more toward MLCAPE vs SB? I've noticed many times in the summer when we get capped our SB will be in the 2000+ range but ml is much less and we have a ton of flat cumulusIts really convective energy at different levels and points for layman terms. For instance SBcape stands for surface based cape which is the convective energy starting at ground level. DCape is downdraft cape which us used to determine the strength of downdrafts. Presence of MLCape with low SBcape tells you that there is a cap and any convection at that point would be elevated.
I look at SBcape first and then on most soundings you will see 0-3km Cape which I look at next.
Sent from my SM-G955U using Tapatalk
Setting spring severe aside when looking for summer tstorms would you look more toward MLCAPE vs SB? I've noticed many times in the summer when we get capped our SB will be in the 2000+ range but ml is much less and we have a ton of flat cumulus
Sent from my SM-G955U using Tapatalk
I think I would look more at SBcape, but Im embarressed to say I only look at soundings when there is severe weather possible. Its like when my wife asks me what the weather will be this week when I havent looked at it because Im focused on something a week away. She always gets me with the comment that I should know because im watching the weather enough.
Z
Zander98al
Guest
Can somebody help breakdown what made april 27th 2011, so bad in terms of meteorological factors? Because ive heard james spann say something like for that day 63 or 64 things on a checklist of 67 for severe weather were in place. Im just curious to what made is SO bad. Living here in it and being around when it happened ive always been traumatized by how the day felt and how many horrible things happened that day. It was what triggered me to want to know more about the weather and being aware of it. But thanks in advance if anyone wants to help or explain the details. Ive looked at weather soundings from that day and dont understand what factors made it so bad. Other than an outflow boundary sitting on top of birmingham and dryline approaching during peak daytime heating. Along with high helicity
Z
Zander98al
Guest
Also another thing i read about that day was there was controlled forest burning in south america which the smoke travelled up into Mississippi and alabama which may have aided in the storms any ideas on how that wouldve effected things?
Also another thing i read about that day was there was controlled forest burning in south america which the smoke travelled up into Mississippi and alabama which may have aided in the storms any ideas on how that wouldve effected things?
Here’s the best I can give, perfect setup with a really powerful negativily tilted trough, lots of sfc moisture, then Capping developed after morning MCS came through which allowed good CAPE (3000+) which argues for extreme updraft development once it broke, also had a EML present, had a strong low pressure system in a good place for severe wx (Kentucky), steep lapses, high Equilibrium layer, ageostrophic flow which would end up aided in extremely violent rotating storms and extreme helicity, supercells found this environment and flourished, they had the environment to there self, combination of extreme CAPE and helicity is extremely dangerous, I think what didn’t help was the fact that the morning storms gave some people a mindset that it was over or it wouldn’t be bad later, as you said tho boundaries had a significant effect, there so underrated in outbreaks, they can aid in some of the most violent tornadoes
Interesting with that setup in 2011, the tornadoes you either had were large stovepipes with side vortices (Tuscaloosa), large wedge tornadoes with the Mesos scraping the ground (Phil Campbell/Hackleburg), or had tornadoes that were very tilted (Cullman)
Z
Zander98al
Guest
, im guessing we got lucky then last storm system that the low wasn't closer too us. More shear and a stronger LLJ would've aided in more instability. Provided the discreet mode of the supercells.Interesting with that setup in 2011, the tornadoes you either had were large stovepipes with side vortices (Tuscaloosa), large wedge tornadoes with the Mesos scraping the ground (Phil Campbell/Hackleburg), or had tornadoes that were very tilted (Cullman)
Z
Zander98al
Guest
, im guessing we got lucky then last storm system that the low wasn't closer too us. More shear and a stronger LLJ would've aided in more instability. Provided the discreet mode of the supercells.
The veterans day 2002 tornado outbreak was the closest analog event for that day which is intresting because it produced long track but less intensity tornado tracks on a Fall day.
Can somebody help breakdown what made april 27th 2011, so bad in terms of meteorological factors? Because ive heard james spann say something like for that day 63 or 64 things on a checklist of 67 for severe weather were in place. Im just curious to what made is SO bad. Living here in it and being around when it happened ive always been traumatized by how the day felt and how many horrible things happened that day. It was what triggered me to want to know more about the weather and being aware of it. But thanks in advance if anyone wants to help or explain the details. Ive looked at weather soundings from that day and dont understand what factors made it so bad. Other than an outflow boundary sitting on top of birmingham and dryline approaching during peak daytime heating. Along with high helicityView attachment 17846
In addition to what Fro said, the day had perfect conditions for discrete supercells. The trough was negatively tilted, but it was broad based and allowed the forcing to be more spread out and allowed the upper level shear to hit the boundary at a sharp angle as you can see by the westerly winds at 500mb.
Another factor was the insanely deep moisture. Normally in a event with this much wind shear and sunshine, the drier air mixes down and drops dewpoints. That has turned many tornado outbreaks into lots of non-tornado producing supercells.
The last big thing was the rain cooled boundary/psuedo warm front that formed across north AL/MS/GA. This backed winds and increased helicity to 800-1000. No wonder this area sparked three tornadoes that are amoung the strongest recorded but many other deadly tornadoes. The day would have been historic without it, but that area topped it off.