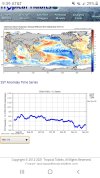
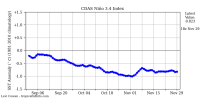
I wrote a relevant pieces on why El Ninos and La Ninas are often different durations in my MS thesis at UNCC.
I'll share some of it here as I think many, even if you're not a meteorologist, would find it interesting and insightful.
"Longer-lived La Ninas would be expected given that during multi-year La Ninas, weaker subsurface winds for a similar changes in SST anomalies, dampens and slows the recharge of the thermocline, ultimately limiting the ability of subsurface anomalies to influence ocean temperatures in the mixed layer (DiNezio and Deser, 2014)
. Moreover, subsurface cold anomalies from off the equator often get entrained into the equatorial Pacific, interrupting the ENSO’s recharge phase following an El Nino (Hu et al, 2014; Deepak et al, 2019) and disturbing the natural succession of ENSO (Kessler 2002), allowing La Ninas to persist longer. Multi-year La Ninas have also been found to be more likely when they were immediately preceded by an intense El Nino (Wu et al, 2019). Our results agree with these mechanisms. It is also possible that remote forcing of West Pacific trade wind variability from the Indian Ocean may play a role in shaping the behavior of multi-year La Ninas (Ohba and Ueda, 2007; Okumura and Deser, 2010; Dong and McPhaden, 2018). Furthermore, climate models often struggle in forecasting multi-year La Nina events (Hu et al, 2014; Barnston et al, 2010), revealing a potential weakness in our understanding of multi-year La Nina behavior and theories such as the recharge/discharge oscillator (Battisti and Hurst, 1988; Suarez and Schopf, 1988; Jin et al, 1997; Wang, 2001; Hu et al, 2014), although some successful model simulations have been conducted that accurately predict multi-year La Ninas (Dinezio et al, 2017)."
"Moreover, unlike La Ninas, multi-year El Ninos are thought to be more closely linked to timing of their onset in the calendar year as well as their “flavor” (i.e. Central or East-Pacific based) (Wu et al, 2019). Studies such as Wu et al (2019) posit that El Ninos that onset later in the calendar year (late northern summer or fall vs spring) and events that are biased towards the central Pacific (i.e. modoki El Ninos; Ashok et al, 2007) are more likely to persist into the following year because the upwelling Rossby Waves that reflect on the western boundary region and become upwelling Kelvin Waves are delayed late enough in the calendar year such that the east-central Pacific cold tongue and Bjerknes feedbacks become re-established and dampen the impact of the upwelling Kelvin Wave. Also, El Ninos being biased towards the central Pacific make the western Pacific less susceptible to enhanced trade winds due to Indian Ocean warming during El Nino (Kug and Kang, 2006; Ohba and Ueda, 2007; Wu et al, 2019) and central Pacific El Ninos tend to be weaker on average than their traditional counterparts, effectively weakening the subsequent upwelling Kelvin Wave that attempts to weaken the El Nino."
Here's some of the relevant literature cited in these excerpts.
"
Nonlinear Controls on the Persistence of La Nina"
https://journals.ametsoc.org/view/journals/clim/27/19/jcli-d-14-00033.1.xml
"
What Controls the Duration of El Nino and La Nina Events?"
https://journals.ametsoc.org/view/journals/clim/32/18/jcli-d-18-0681.1.xml
"Impact of multiyear La Niña events on the South and East Asian summer monsoon rainfall in observations and CMIP5 models"
https://link.springer.com/article/10.1007/s00382-018-4561-0
"Why were some La Ninas followed by another La Nina?"
https://link.springer.com/article/10.1007/s00382-013-1917-3
"Is ENSO a cycle of series of events?"
https://agupubs.onlinelibrary.wiley.com/doi/10.1029/2002GL015924
"
An Impact of SST anomalies in the Indian Ocean in acceleration of the El Nino to La Nina transition"
https://www.jstage.jst.go.jp/article/jmsj/85/3/85_3_335/_article
"
Asymmetry in the Duration of El Nino and La Nina"
https://journals.ametsoc.org/view/journals/clim/23/21/2010jcli3592.1.xml
"A Proposed Mechanism for the Asymmetric Duration of El Niño and La Niña"
https://journals.ametsoc.org/view/journals/clim/24/15/2011jcli3999.1.xml
"
Unusually warm Indian Ocean sea surface temperatures help to arrest development of El Niño in 2014"
https://www.osti.gov/pages/biblio/1463348
"Verification of the First 11 Years of IRI’s Seasonal Climate Forecasts"
https://journals.ametsoc.org/view/journals/apme/49/3/2009jamc2325.1.xml
"A 2 Year Forecast for a 60–80% Chance of La Niña in 2017–2018"
https://agupubs.onlinelibrary.wiley.com/doi/full/10.1002/2017GL074904
"
Interactive feedback between ENSO and the Indian Ocean"
https://journals.ametsoc.org/view/journals/clim/19/9/jcli3660.1.xml


