• Hello, please take a minute to check out our awesome content, contributed by the wonderful members of our community. We hope you'll add your own thoughts and opinions by making a free account!

Observations Climate Stats/Extremes/Normals

LickWx

Member
Joined
Mar 19, 2019
Messages
12,202
Reaction score
15,003
Location
Lizard Lick, NC
This is a thread dedicated to as the title said all things climate !

I’ll start us off with average hours spent at certain heat index temps 1973-2020 at RDU.

network:NC_ASOS::zstation:RDU::syear:1973::eyear:2020::year:2020::var:heatindex::ytd:no::inc:no::dpi:100.png
 
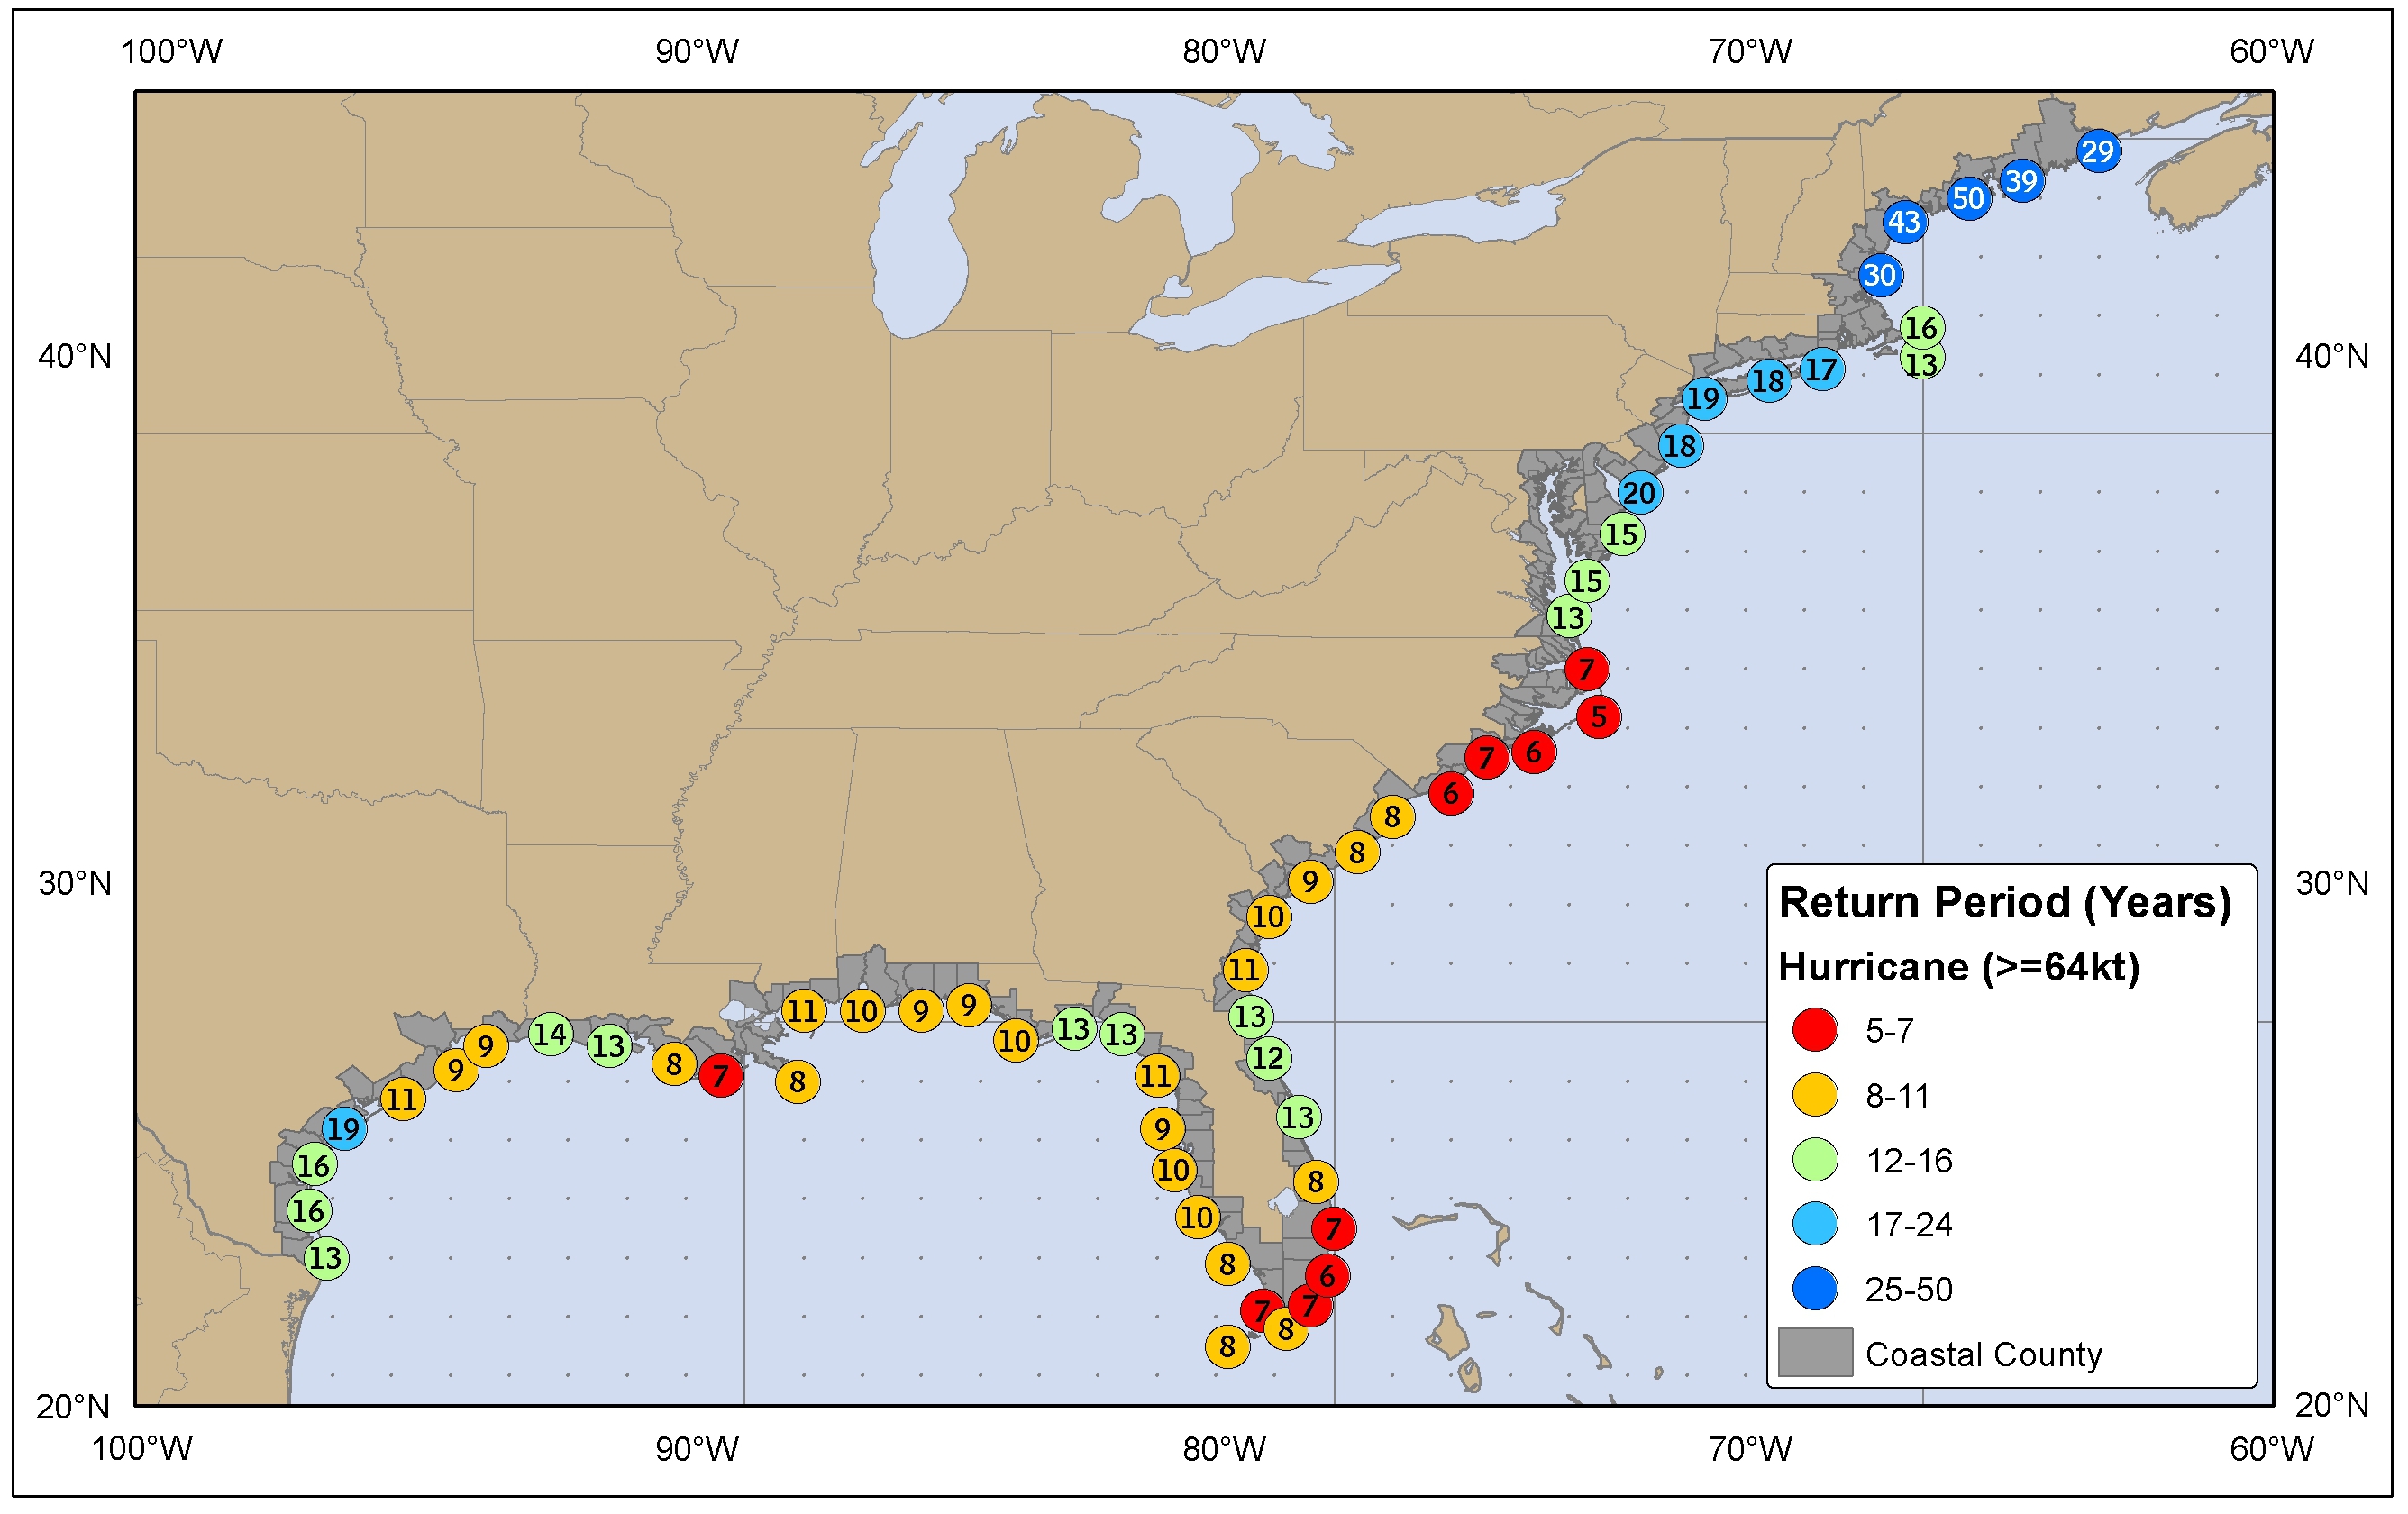
Up to 2010 for data, if the map was up to 2019 think places like the coast of NC would have return periods that are much shorter given we have seen a landfalling hurricane pretty much every year it seems like. Not a surprising map, although a bit surprised that the northern coast of NC has a short return period.


return_hurr.jpg
 
Or a lot of new construction with asphalt and concrete.

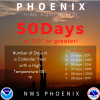
I didn’t know there was a rush to relocate to Phoenix and move businesses to there. Of course I don’t follow trends on the economy just on climate trends.


Sent from my iPhone using Tapatalk
 
I didn’t know there was a rush to relocate to Phoenix and move businesses to there. Of course I don’t follow trends on the economy just on climate trends.


Sent from my iPhone using Tapatalk
Arizona and Phoenix especially are booming. They build very sprawling developments out there, their urban heat island effect is intense.
 
Arizona and Phoenix especially are booming. They build very sprawling developments out there, their urban heat island effect is intense.
Check surrounding cities like Yuma, Tuscon, Prescott, etc, and see if there is a similar pattern.. then the likelihood of UHI effect being a significant cause is less likely. Most of the 10 warmest years in Yuma for instance are in the past 20 years.
 
Check surrounding cities like Yuma, Tuscon, Prescott, etc, and see if there is a similar pattern.. then the likelihood of UHI effect being a significant cause is less likely. Most of the 10 warmest years in Yuma for instance are in the past 20 years.

Plus UHIs are most prominent for increased low temperatures, high temperatures aren’t affected as significantly.
 
Links to access 91-20 Climo Data


Link for full access and Pdf/csv downloads


Nowdata has the averages in as well
 
Some 91-20 data in pretty wiki box form. Thew dewpoint data for rdu and clt is old and outdated as ----, add 2 degrees to each month to get an idea of the actual modern avg dews are. Those are from 61-90 in the box. Weird... mean rdu april minimum is above freezing now... it was 30 81-10. hmmmm i thought we were getting colder later and later !

y2mSaEY.png


Snow data is 81-10 hatteras since it seems 91-20 they dont got none which makes me mad. why dont we got snow data! In all likelihood it dropped a solid inch since dec 1989 is out of the data and that skewed it massively
kqmVXil.png


1620240617513.png


1620240656644.png


1620240691945.png


1620240745434.png
 
I’m a bit puzzled by how Southport has a diurnal temperature variation of nearly 25 degrees in January, higher than inland spots like RDU, CLT, etc. Southport is right on the coast, so I would’ve thought they’d have relatively little diurnal variation. Only thing I can think of is that it’s a rural area.

Also, Hatteras will likely see a modest drop in their snowfall average with 1989 falling out of the dataset, but they also got a good 6-7” storm in January 2011 and I think they got a few other snowfalls last decade, so I’m not sure it’ll be cataclysmic.
 
I’m a bit puzzled by how Southport has a diurnal temperature variation of nearly 25 degrees in January, higher than inland spots like RDU, CLT, etc. Southport is right on the coast, so I would’ve thought they’d have relatively little diurnal variation.

Also, Hatteras will likely see a modest drop in their snowfall average with 1989 falling out of the dataset, but they also got a good 6-7” storm in January 2011 and I think they got a few other snowfalls last decade, so I’m not sure it’ll be cataclysmic.
Decembers snowfall will def drop pretty dramtically, I have no clue about southport tbh lol! Its one of those station things i guess, theres a station near the airport that avgs 53/34 in jan for raleigh.
 
Also, the difference between Roxboro and RDU for low temperatures is kind of shocking (and high temperatures are basically identical). We’re talking about 6 degrees difference throughout winter! Maybe it’s always been that way. I guess Roxboro doesn’t get much UHI.
 
Also, the difference between Roxboro and RDU for low temperatures is kind of shocking (and high temperatures are basically identical). We’re talking about 6 degrees difference throughout winter! Maybe it’s always been that way. I guess Roxboro doesn’t get much UHI.
I dont know that its UHI alone, I think Roxboro could be a bit of a frost hollow contributing to the larger than expected diurnals. A typical winter diurnal in the piedmont, non uhi, non frost hollowish seems to be 21-22 degree range where as roxboro is 24-25.
 
I dont know that its UHI alone, I think Roxboro could be a bit of a frost hollow contributing to the larger than expected diurnals. A typical winter diurnal in the piedmont, non uhi, non frost hollowish seems to be 21-22 degree range where as roxboro is 24-25.
Also, the differences they are showing for Durham vs. RDU are surprising to me. 51.9/31.8 for RDU in January compared to 48.9/27.9 for Durham. 63.3/40.3 vs. 60.7/37.2 for March. RDU and Durham aren’t 15 miles apart... And Durham is coming in colder than Greensboro.
 
RDU and CLT both seem to have pretty healthy large diurnals, I dont think UHI is yet as big of an issue for those stations. Take a look at Atlanta or DC if you want to see what some serious UHI does to diurnals lol! I think Atlantas diurnal range is like 18 degrees at the major airport. Pretty low for an inland us southern city. RDU and CLT still have a solid 20 degree diurnal.
 
Last edited:
Also, the differences they are showing for Durham vs. RDU are surprising to me. 51.9/31.8 for RDU in January compared to 48.9/27.9 for Durham. 63.3/40.3 vs. 60.7/37.2 for March. RDU and Durham aren’t 15 miles apart... And Durham is coming in colder than Greensboro.
I think thats because the station is messed up and it stopped reporting in the 90s, but they still gave it normals lol. Its crap, some of these stations are total crap. Check out falls lake for example lol!
 
I think thats because the station is messed up and it stopped reporting in the 90s, but they still gave it normals lol. Its crap, some of these stations are total crap. Check out falls lake for example lol!
That would certainly explain it. I’d expect Durham to be a bit cooler than RDU, but not by much.

Kind of depressing RDU averages a 40F low in March now.
 
That would certainly explain it. I’d expect Durham to be a bit cooler than RDU, but not by much.

Kind of depressing RDU averages a 40F low in March now.
It was like 39.9 in the 81-10 data set lol! Hardly much of a change but yeah it takes away the novelty of saying we have 4 months with avg lows sub 40. Now its just 3 and Jan is .2 from breaking freezing.
 
Pro tip- One good way to tell how much UHI a place has is to compare its avg dews to the avg low. They should essentially be on top of each other, if the low is way higher than the other sure fire way of telling theres a crap ton of UHI.
 
It was like 39.9 in the 81-10 data set lol! Hardly much of a change but yeah it takes away the novelty of saying we have 4 months with avg lows sub 40. Now its just 3 and Jan is .2 from breaking freezing.
Ah...for some reason I thought it was a bit lower. Makes March seem less wintry when we’re talking about average lows in the 40s. At least it probably takes until around mid-March for that to happen.
 
Here is one I think you guys will like a lot. @GeorgiaGirl show this to your dad I know he would love these links and the boxes some people on another forum im on made interpreting raleighs climate during the ice age from them roughly. These values wont be exact as this is all interpolated data but it should be close, during the ice age climates varied widely. The further north you were the more different from todays climate it was where as the further south you went the less change, Florida and especially south florida were not that much colder than today. Miami was still a very very warm climate even during the ice age, cooler winters and summers but nothing as drastically different as we see for Raleigh and especially places even further north. This is the post of the year right here for yall snow weenies . @SD @Bham 99 @Sleet City USA @superjames1992. I deserve an award for this post because I just satisfied every weenies biggest question, what was it like during the ice age?

Means roughly using NCAR data set

1620247869914.png


Raleigh means ( not avg highs/lows but means). Essentially a very solid Dfb climate, not quite subarctic as both May and Sep were still much higher than the 50 degree mean cut off. Looks a lot like a modern day climate in New England or Eastern Canada. Im dubious of the precip data as conventional knowledge is it was much drier during the ice age, but of course that winter precip would be snow mostly lol. Keep in mind its harder to get a good idea if the location is closer to water as you can see the water is much warmer lol. Luckily Raleigh is inland so this should be a safe bet, and elevation doesnt change drastically so the smoothed over grid should be good.

1620247969115.png

Heres another fun box estimating Raleighs climate from a different ice age data set. This one has holocene optimum as well, would be interesting to see the climate then. Summers would have been a good bit hotter I bet relative to today given the sun was further overhead on the solstice. The person also did OKC, theres a few more we made if yall want to see. I think he overdid the snow for raleigh, modern day climes in our warmer wetter times with those averages in the eastern us arent that snowy. The records are obviously just guesses based on modern day equivalents.

1620248174849.png


Heres the modern day equivalent of ice age Raleigh. Berlin is a frost hollow however, pretty well known cold spot in NH, so may not be best gauge of what kind of records to expect.
1620248306895.png
 
Last edited:
Here is one I think you guys will like a lot. @GeorgiaGirl show this to your dad I know he would love these links and the boxes some people on another forum im on made interpreting raleighs climate during the ice age from them roughly. These values wont be exact as this is all interpolated data but it should be close, during the ice age climates varied widely. The further north you were the more different from todays climate it was where as the further south you went the less change, Florida and especially south florida were not that much colder than today. Miami was still a very very warm climate even during the ice age, cooler winters and summers but nothing as drastically different as we see for Raleigh and especially places even further north. This is the post of the year right here for yall snow weenies . @SD @Bham 99 @Sleet City USA @superjames1992. I deserve an award for this post because I just satisfied every weenies biggest question, what was it like during the ice age?

Means roughly using NCAR data set

View attachment 83278


Raleigh means ( not avg highs/lows but means). Essentially a very solid Dfb climate, not quite subarctic as both May and Sep were still much higher than the 50 degree mean cut off. Looks a lot like a modern day climate in New England or Eastern Canada. Im dubious of the precip data as conventional knowledge is it was much drier during the ice age, but of course that winter precip would be snow mostly lol. Keep in mind its harder to get a good idea if the location is closer to water as you can see the water is much warmer lol. Luckily Raleigh is inland so this should be a safe bet, and elevation doesnt change drastically so the smoothed over grid should be good.

View attachment 83279

Heres another fun box estimating Raleighs climate from a different ice age data set. This one has holocene optimum as well, would be interesting to see the climate then. Summers would have been a good bit hotter I bet relative to today given the sun was further overhead on the solstice. The person also did OKC, theres a few more we made if yall want to see. I think he overdid the snow for raleigh, modern day climes in our warmer wetter times with those averages in the eastern us arent that snowy. The records are obviously just guesses based on modern day equivalents.

View attachment 83280


Heres the modern day equivalent of ice age Raleigh. Berlin is a frost hollow however, pretty well known cold spot in NH, so may not be best gauge of what kind of records to expect.
View attachment 83281

Well you got to figure with the ice sheet several hundred miles north where temps in summer would barely be above freezing you can imagine Raleigh would be chilly. Cypress trees where also everywhere in NC due to the much colder climate.


Sent from my iPhone using Tapatalk
 
Here is one I think you guys will like a lot. @GeorgiaGirl show this to your dad I know he would love these links and the boxes some people on another forum im on made interpreting raleighs climate during the ice age from them roughly. These values wont be exact as this is all interpolated data but it should be close, during the ice age climates varied widely. The further north you were the more different from todays climate it was where as the further south you went the less change, Florida and especially south florida were not that much colder than today. Miami was still a very very warm climate even during the ice age, cooler winters and summers but nothing as drastically different as we see for Raleigh and especially places even further north. This is the post of the year right here for yall snow weenies . @SD @Bham 99 @Sleet City USA @superjames1992. I deserve an award for this post because I just satisfied every weenies biggest question, what was it like during the ice age?

Means roughly using NCAR data set

View attachment 83278


Raleigh means ( not avg highs/lows but means). Essentially a very solid Dfb climate, not quite subarctic as both May and Sep were still much higher than the 50 degree mean cut off. Looks a lot like a modern day climate in New England or Eastern Canada. Im dubious of the precip data as conventional knowledge is it was much drier during the ice age, but of course that winter precip would be snow mostly lol. Keep in mind its harder to get a good idea if the location is closer to water as you can see the water is much warmer lol. Luckily Raleigh is inland so this should be a safe bet, and elevation doesnt change drastically so the smoothed over grid should be good.

View attachment 83279

Heres another fun box estimating Raleighs climate from a different ice age data set. This one has holocene optimum as well, would be interesting to see the climate then. Summers would have been a good bit hotter I bet relative to today given the sun was further overhead on the solstice. The person also did OKC, theres a few more we made if yall want to see. I think he overdid the snow for raleigh, modern day climes in our warmer wetter times with those averages in the eastern us arent that snowy. The records are obviously just guesses based on modern day equivalents.

View attachment 83280


Heres the modern day equivalent of ice age Raleigh. Berlin is a frost hollow however, pretty well known cold spot in NH, so may not be best gauge of what kind of records to expect.
View attachment 83281

Really good stuff here. Not much else for me to say outside of that other than it would definitely have been nice to experience a cooler climate.

My dad would probably have more commentary, I have likely read at least some of his Ice Age research but my memory is just trash lol.
 
Really good stuff here. Not much else for me to say outside of that other than it would definitely have been nice to experience a cooler climate.

My dad would probably have more commentary, I have likely read at least some of his Ice Age research but my memory is just trash lol.
I've read a lot of his stuff. He is a cheeky fellow as well lol, I remember reading an article about neanderthals that he wrote and his example of what they looked like was some hot naked redhead which he posted a pic of lmao! His dream if I remember correctly is to live in Ice age coastal georgia among the mega fauna! He also posted lots about his trips across the south !
 
Last edited:
Interesting that the number of days with highs and lows below freezing also went up at GSO, RDU, and FAY with the new climate normals, despite average temperatures overall increasing. Of course, number of days with highs in the 90s went up by even more.


AA600922-F781-48CC-96D0-6F9E2BE1EF8B.png

E97D9B48-4D84-40B7-8176-8AECF070080A.png
 
Interesting that the number of days with highs and lows below freezing also went up at GSO, RDU, and FAY with the new climate normals, despite average temperatures overall increasing. Of course, number of days with highs in the 90s went up by even more.


View attachment 83402

View attachment 83403
I saw that , it actually went down not up . I know this sounds weird but there’s ------- different values even for that ---- too. I’ve seen 2 diff values from NCEI for the 81-10 days below freezing . If you look at raw it went down as well. Smh none of it makes sense lol. It went up in your comparison because they are comparing the raw one to whatever that second number will be which comes out in the stupid annual summary each year . That’s where I find that information.

Raw to raw makes sense , why can’t we just use raw data .
 
Sorry @Lickwx I didn't see this thread before or I would have been posting here instead. We have found a new winner, and this is official from NOAA for the University of South Carolina, the gates of hell. Coming in at #1 averaging a whopping .2" of snow per season and a July high of 95.6F....

1620408477553.png
 
Here are some of our higher elevation stations in the region:

Caesars Head, SC
1620408800815.png
Georgia doesn't have any official reporting stations on any of their peaks listed, which is annoying. Here is the highest city in the metro area at 1500', Jasper.
1620409022847.png
Mt. Mitchell, NC
1620409076732.png
Beech Mt, NC
1620409121623.png
Mt. Leconte, TN
1620409168234.png
 
@SD here are the 10 coldest lows in Raleigh. Crazy how most of them happened from 1960-1990


View attachment 97186
These have me digging into the ol memory. I think the 2 in 94 was supposed to be below 0. I remember Fishel talking about how hard it was for our area to stay in the teens low 20s during the day in full sun. The 0 in 96 probably came after the big ice/snow event which was one of the coolest events that doesn't get talked about enough.

Really I would have expected there to be more lows 0-5 to be honest. Kind of goes to show how hard it is for us to get extreme cold around here
And I think most if not all of those low single digits and sub zero readings were probably with snow/ice on the ground.
 
Back
Top