BrickTamland
Member
Storms incoming from the north.

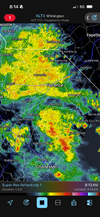
Yeah this is a strong storm. I didn’t get the memo. It woke me upMan I’m getting absolutely rocked right now power just went out transformers blowing
Congratulations. Must be nice. I'm back to regular scheduled programming up here. Can't make this upTorrential rain here this morning. Crazy wind. Thunder and lightning. All of it.View attachment 195737

Impressive fringe job ol’ pal! I thought my gutters were going to seperate from the house from the weight of the rainCongratulations. Must be nice. I'm back to regular scheduled programming up here. Can't make this upView attachment 195739

The drought continues to worsen. 80% of Georgia is now in an Extreme Drought and 33% is an Exceptional Drought. View attachment 195741